Creating a Node-RED flow with simulated OPC-UA data
3 minute read
1. Creating a OPC-UA Node-RED flow
If you want to download the flow directly, make sure to visit our Node-Red libary.
If you are using a virtual machine type in your browser
localhost:1880/noderedor use the port forwarding feature from UMHLens.If you are using an edge device type in your browser
(ip of edge-device):1880/nodered.You should now see an empty Node-RED flow if everything is working correctly.
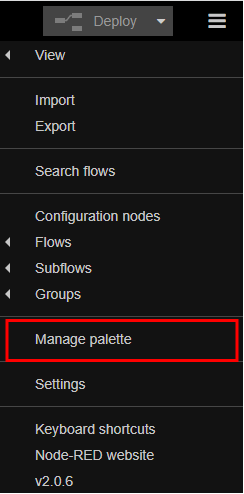
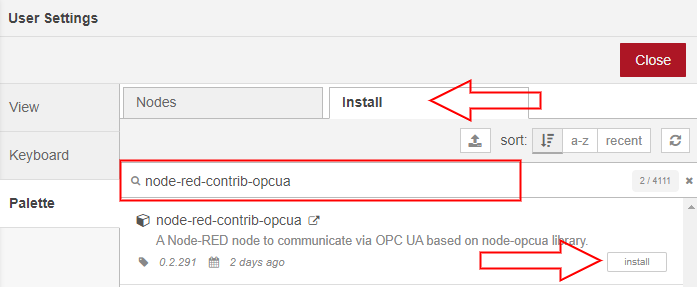
The first thing we need to do is add a new palette. To do this, click on the three lines in the upper right corner and select Manage palette. Click on install and add the following node-red-contrib-opcua. Then click on install.
Next, drag an inject node, two function nodes, an opcua-client node and an mqtt-out node into the flow. Connect them as shown in the image below.

FYI:We now create a flow that monitors a Haber-Bosch synthesis.
Open the inject node and select string under msg.topic. Write
multiplein the string field and leave the field at msg.payload empty. Now select inject once after 0.1 seconds then at the bottom and click done.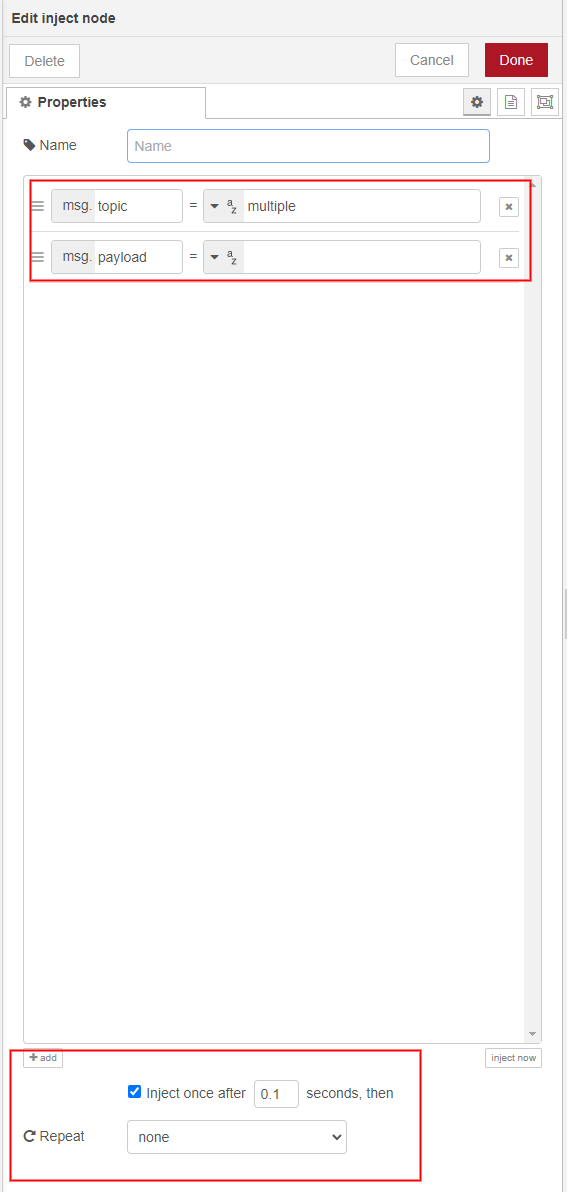
Next, open the first function node and add the code below. Once you have done that click Done.
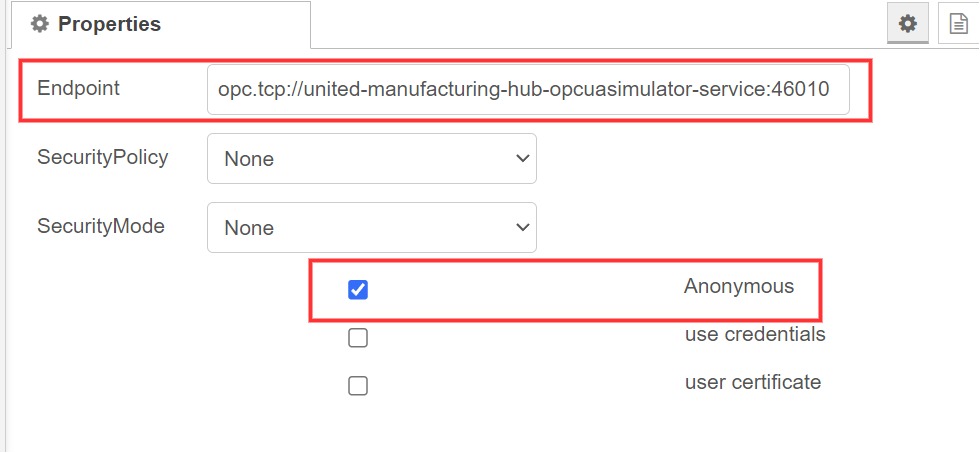
msg.topic = "multiple";
msg.payload = [];
msg.payload.push({nodeId: "ns=2;s=Pressure"});
msg.payload.push({nodeId: "ns=2;s=ConcentrationH2"});
msg.payload.push({nodeId: "ns=2;s=ConcentrationN2"});
msg.payload.push({nodeId: "ns=2;s=ConcentrationNH3"});
msg.payload.push({nodeId: "ns=2;s=Temperature"});
return msg;
Next, open the opcuaclinet-node and edit the endpoint by clicking on the pencil to the right of it. Enter your opcua-simulator servicename with the associated internal port, select Anonymous and click add. Select SUBSCRIBE under action and click Done.
Now open the second function node and paste the code below. Once this is done click Done.
if (msg.payload && msg.payload.value) {
  var key = msg.topic.replace("ns=2;s=", '')
  var value = msg.payload.value.value;
  var payload =`
  {
    "timestamp_ms":` + Date.now() + `, "` +
    key +`": `+ value + `
  }`
  msg.payload = payload
  msg.topic = "ia/factoryinsight/testLocation/testMachine/processValue/" + key
  return msg;
}
Last but not least open the mqttout node and configure the server with the service name of hivemq as host (located in openlens under services→name) and the port with:
1883. You also have to configure the security tab with username:node-redand password:INSECURE_INSECURE_INSECURE. Click Done.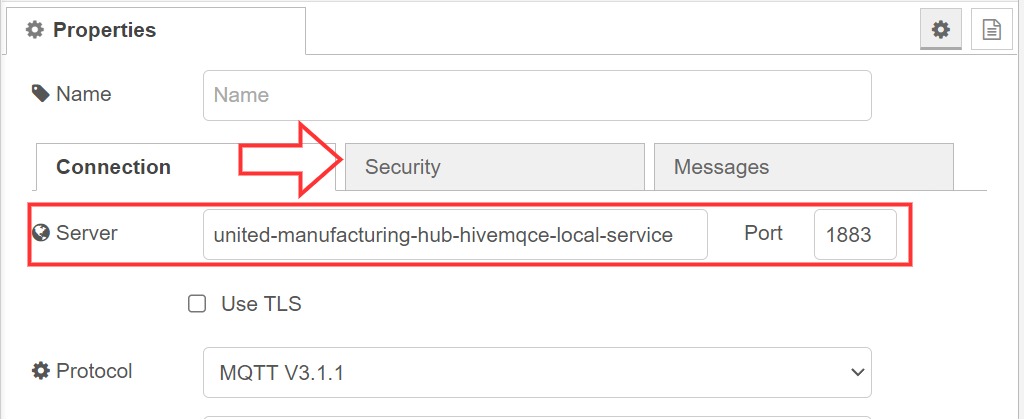
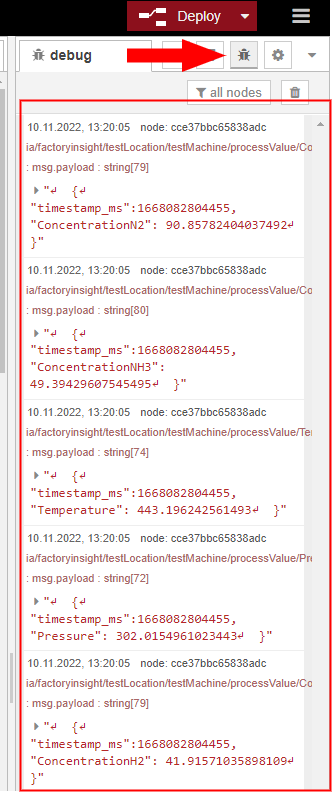
To check if everything works drag a mqtt-in node and a debug node into your flow and connect them. Open the mqtt-in node and select the configured server . Next you need to paste
ia/factoryinsight/testLocation/testMachine/processValue/#into topic. Click done and hit deploy on the top right.Select debug messages located at the top right. If everything works correctly, you should see the simulated OPC-UA data.
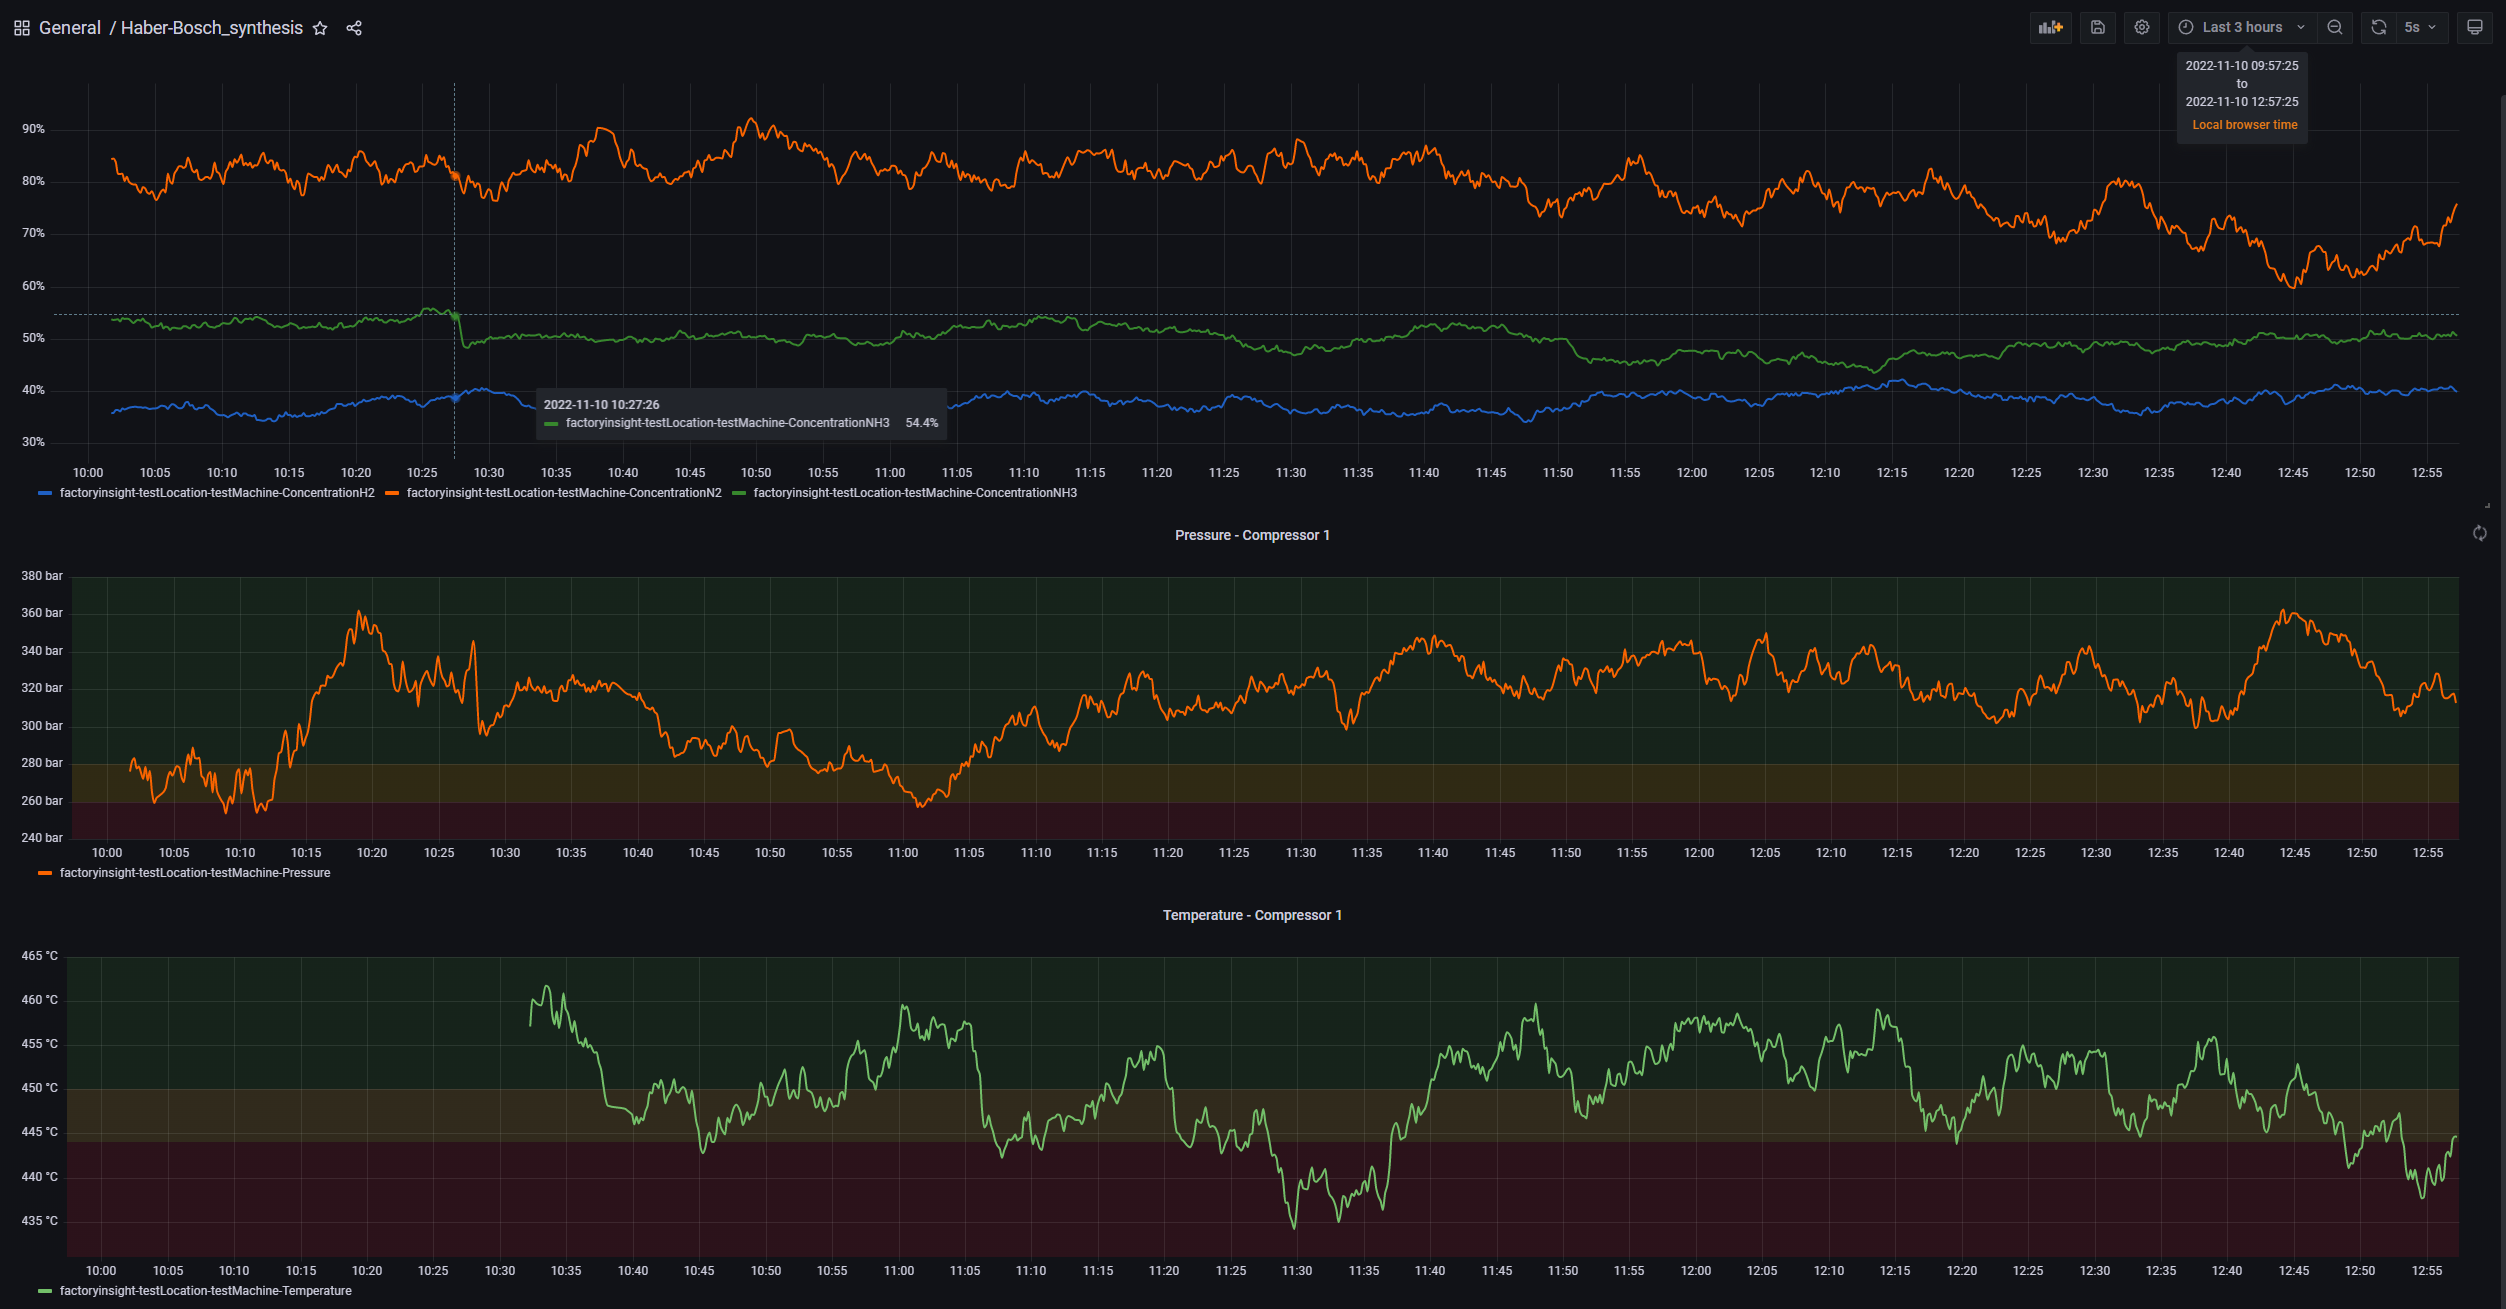
This Node-RED flow will look something like this in Grafana. So make sure you follow our guide so you too can create a dashboard like this.
What’s next?
Make sure to go back to our Getting Started page to follow our Getting-Started-Guide!
Next up is Data Visualization, but you can also try out other data-simulators like the PackML-Simulator or the MQTT-Simulator.