Creating a Node-RED flow with simulated MQTT data
4 minute read
With the version 0.9.6 the United Manufacturing Hub automatically generates messages about a simulated machine, let’s imagine it is a cooking pot. It has the three message types “Temperature”, “Pressure” and “Humidity” with the root topic “ia/raw/development/ioTSensors”, so messages would have the topic of “/ia/raw/development/ioTSensors/Temperature”, for example. If you installed the correct version of the United Manufacturing Hub, you should then be able to process that test data with Node-RED.
2. Connecting to Node-RED
If you are using a virtual machine, type in your browser
localhost:1880/noderedor use the port-forwarding feature from UMHLens.If you are using an edge device, type in your browser
(ip of edge-device):1880/nodered.If everything is working correctly, you should now see an empty Node-RED flow.
3. Creating your first flow with simulated MQTT-Data
In the following, you are going to create your first Node-RED flow with simulated MQTT-Data. If you want to download this flow, you can visit our node-red-template libary.
Drag from the left coulmn a mqtt-in- , mqtt-out- and a debug-node into your flow.
Connect the mqtt-in and the debug-node.

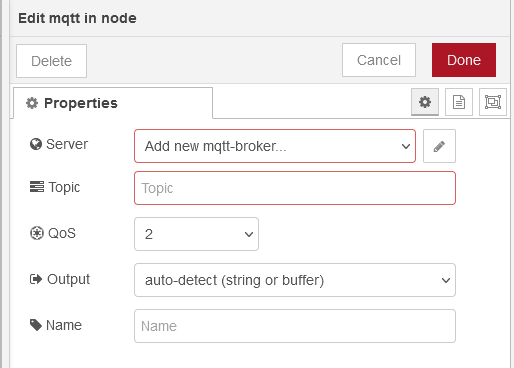
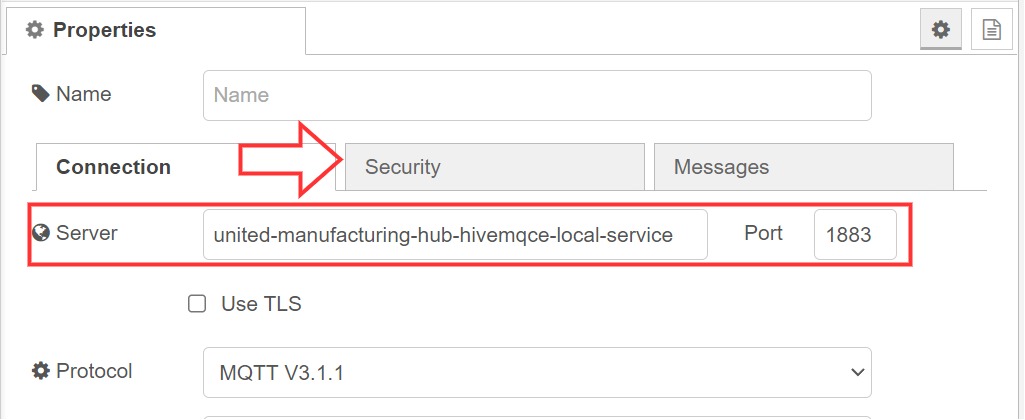
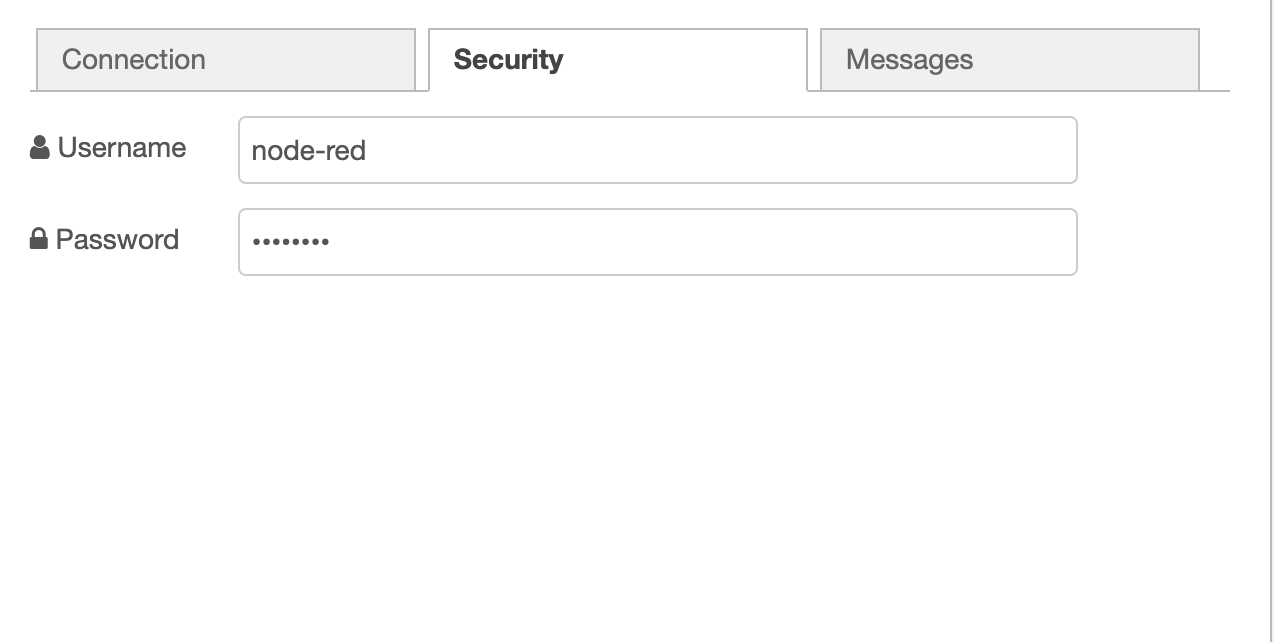
Double click the mqtt-in-node and add a new mqtt broker. Therefore click on edit and use the service name of hivemq as host (located in openlens under services→name). You also have to configure the security tab with username:
node-redand password:INSECURE_INSECURE_INSECURE). Leave the Port as autoconfigured and click on Add.
In order to see all incoming messages, type in Topic
ia/#. Then click Done.To make the changes effective we need to click Deploy on the top right.
Now to see the debug-information, click on the Debug-messages under Deploy.
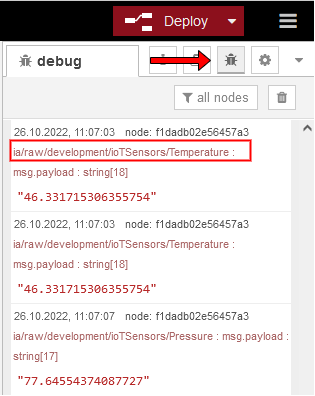
In this column, we can see all the incoming messages and their respective topic. The incoming topics have the format
ia/raw/development/ioTSensors/.For this tutorial, we are only using the temperature topic but you can choose whatever you want. Now copy the temperature topic (
ia/raw/development/ioTSensors/Temperature) , open the mqtt-in node and paste the copied topic in Topic. Click Done and hit Deploy.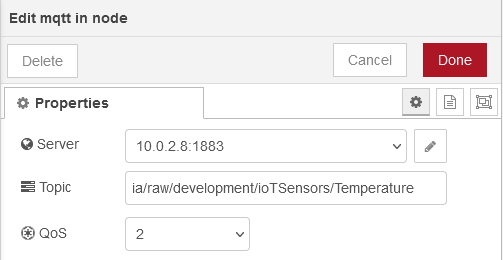
The incoming messages need to be formatted in order to be used by the rest of the stack. In order to do that, drag a json node and a function node into your flow. Now connect the following: mqtt in → json→ function → mqtt out.

Open the function node and paste in the following:
msg.payload ={

    "timestamp_ms": Date.now(),
    "temperature": parseFloat(msg.payload, 10)
}

msg.topic = "ia/factoryinsight/Aachen/testing/processValue";

return msg;
Quick explanation: We are creating a new object (array) with two keys
timestamp_msandtemperatureand their corresponding valueDate.now()andparseFloat(msg.payload,10).The
parseFloatfunction converts the incoming string into a float with the base 10 and theDate.now()creates a timestamp.We also created a
msg.topicfor the mqtt-out node, which will automatically apply this topic and therefore we dont need to configure the mqtt-out node, but we still have to open our mqtt-out-node and click done in order to connect it.Drag in another mqtt-in node and give it the topic:
ia/factoryinsight/Aachen/testing/processValue(Topic of the mqtt-out-node configured in the function-node). Connect a debug node to your new mqtt-in node and hit deploy.
We can now see our new converted message under Debug-messages. You can clear the old messages by clicking the trash bin.
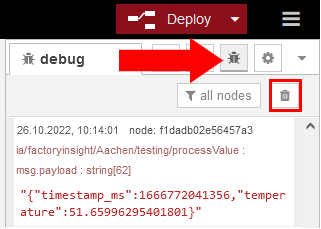
Congratulations! You have now successfully converted the incoming message and exported it via mqtt. Since we are now only exporting temperature, but not really worked with the data, we want to create a function that counts the critical temperature exceedances.
Drag another function-node into your flow, open it and navigate to On Start.

Paste in the following code, which will be runonly on start:
flow.set("count", 0);
flow.set("current", 0)
Then click on On-Message and paste in the following and hit done:
flow.set("current",msg.payload);
if (flow.get("current")>47){
    flow.set("count", flow.get("count")+1);
    msg.payload = {"TemperatureWarning":flow.get("count"),"timestamp_ms":Date.now()}
    msg.topic = "ia/factoryinsight/Aachen/testing/processValue";
    return msg;
}
The pasted in code will work as shown in the diagram below.

Finally, connect the function-node like shown below and hit deploy.

If the incoming value of temperature is now greater than 47, you will see another message consisting of TemperatureWarnings and a timestamp in debug-messages.
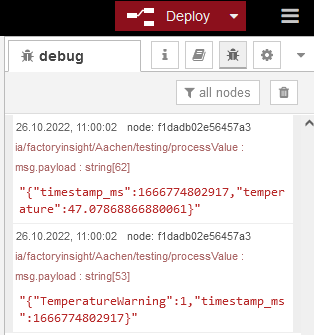
If you want to display your created data, make sure to follow our guide. This flow will look something like this in Grafana:

What’s next?
Make sure to go back to our Getting Started page to follow our Getting-Started-Guide!
Next up is Data Visualization, but you can also try out other data-simulators like the PackML-Simulator or the OPC-UA-Simulator.