Getting started on data visualization with Grafana
2 minute read
Here you are introduced to Grafana and get to setup easy Dashboards and visualize simple data.
We hope you can go from there to customize your own dashboards and update them to your own likings.
We also have a visual guide on Youtube about it.
Introduction
As the first step, you need to open Grafana by opening the following URLs in your browser: http://<IP>:8080 e.g http://192.168.1.2.
You can log in with the username admin . The password you can get through UMHLens.

First, press on the left side in UMHLens on Configuration and then Secrets.
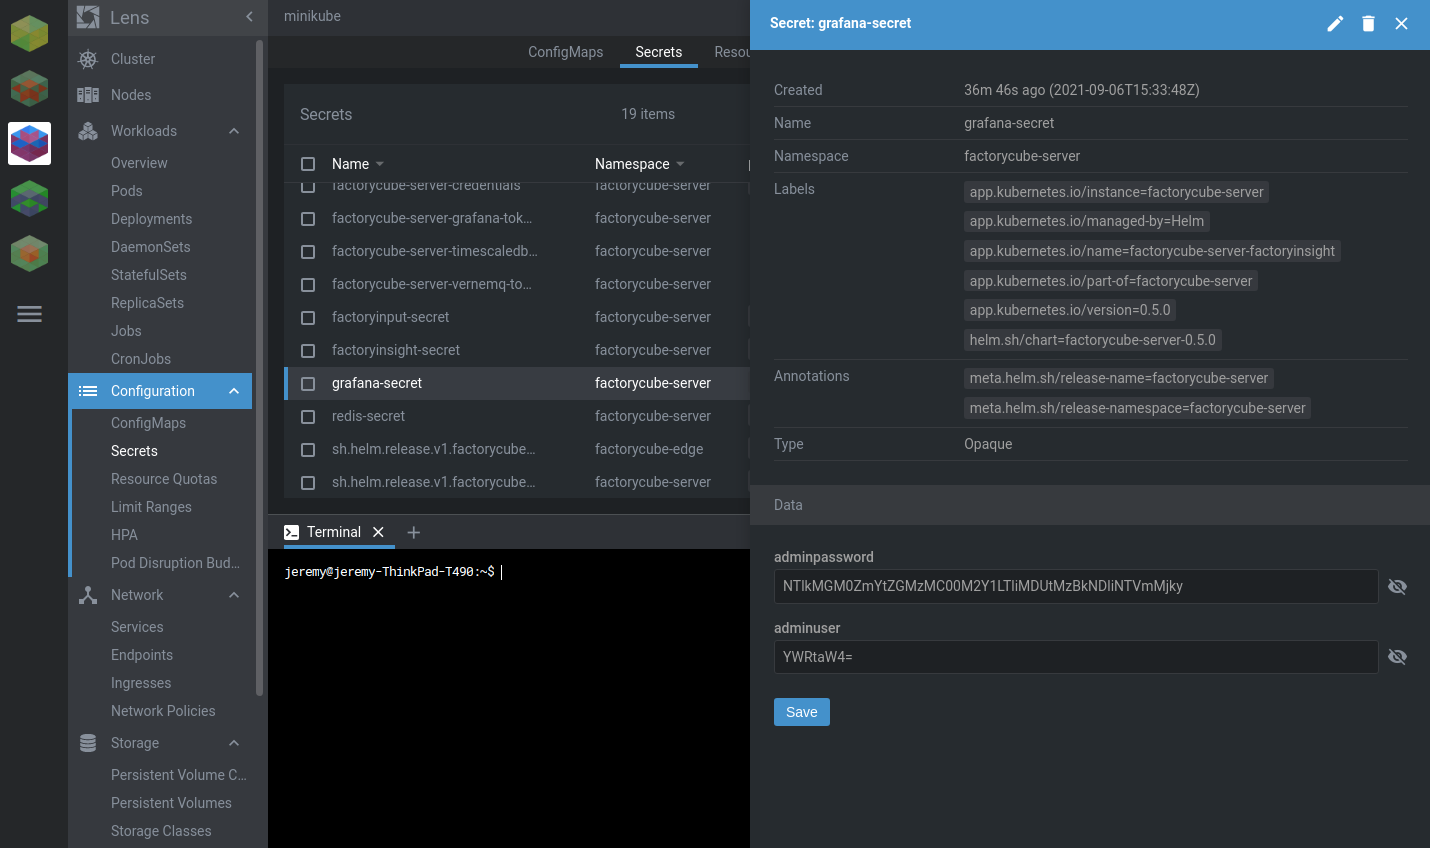
Then select grafana-secret

Press the eye on the right to decrypt the password. You can then copy and paste the password into Grafana to login.
Next, create a new dashboard by clicking the + on the left side:
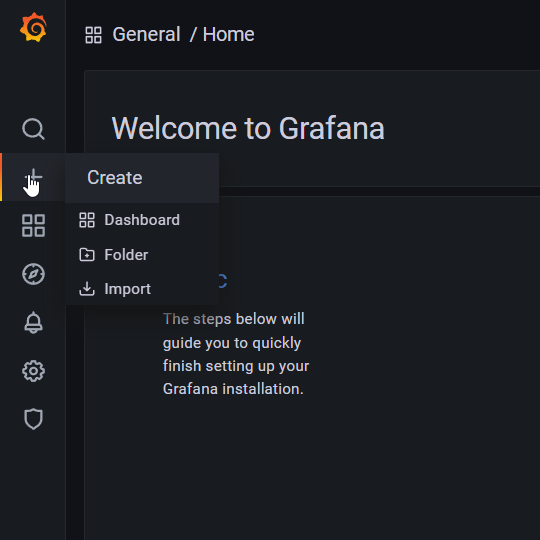
After clicking Add an Empty Panel you should see the following settings:
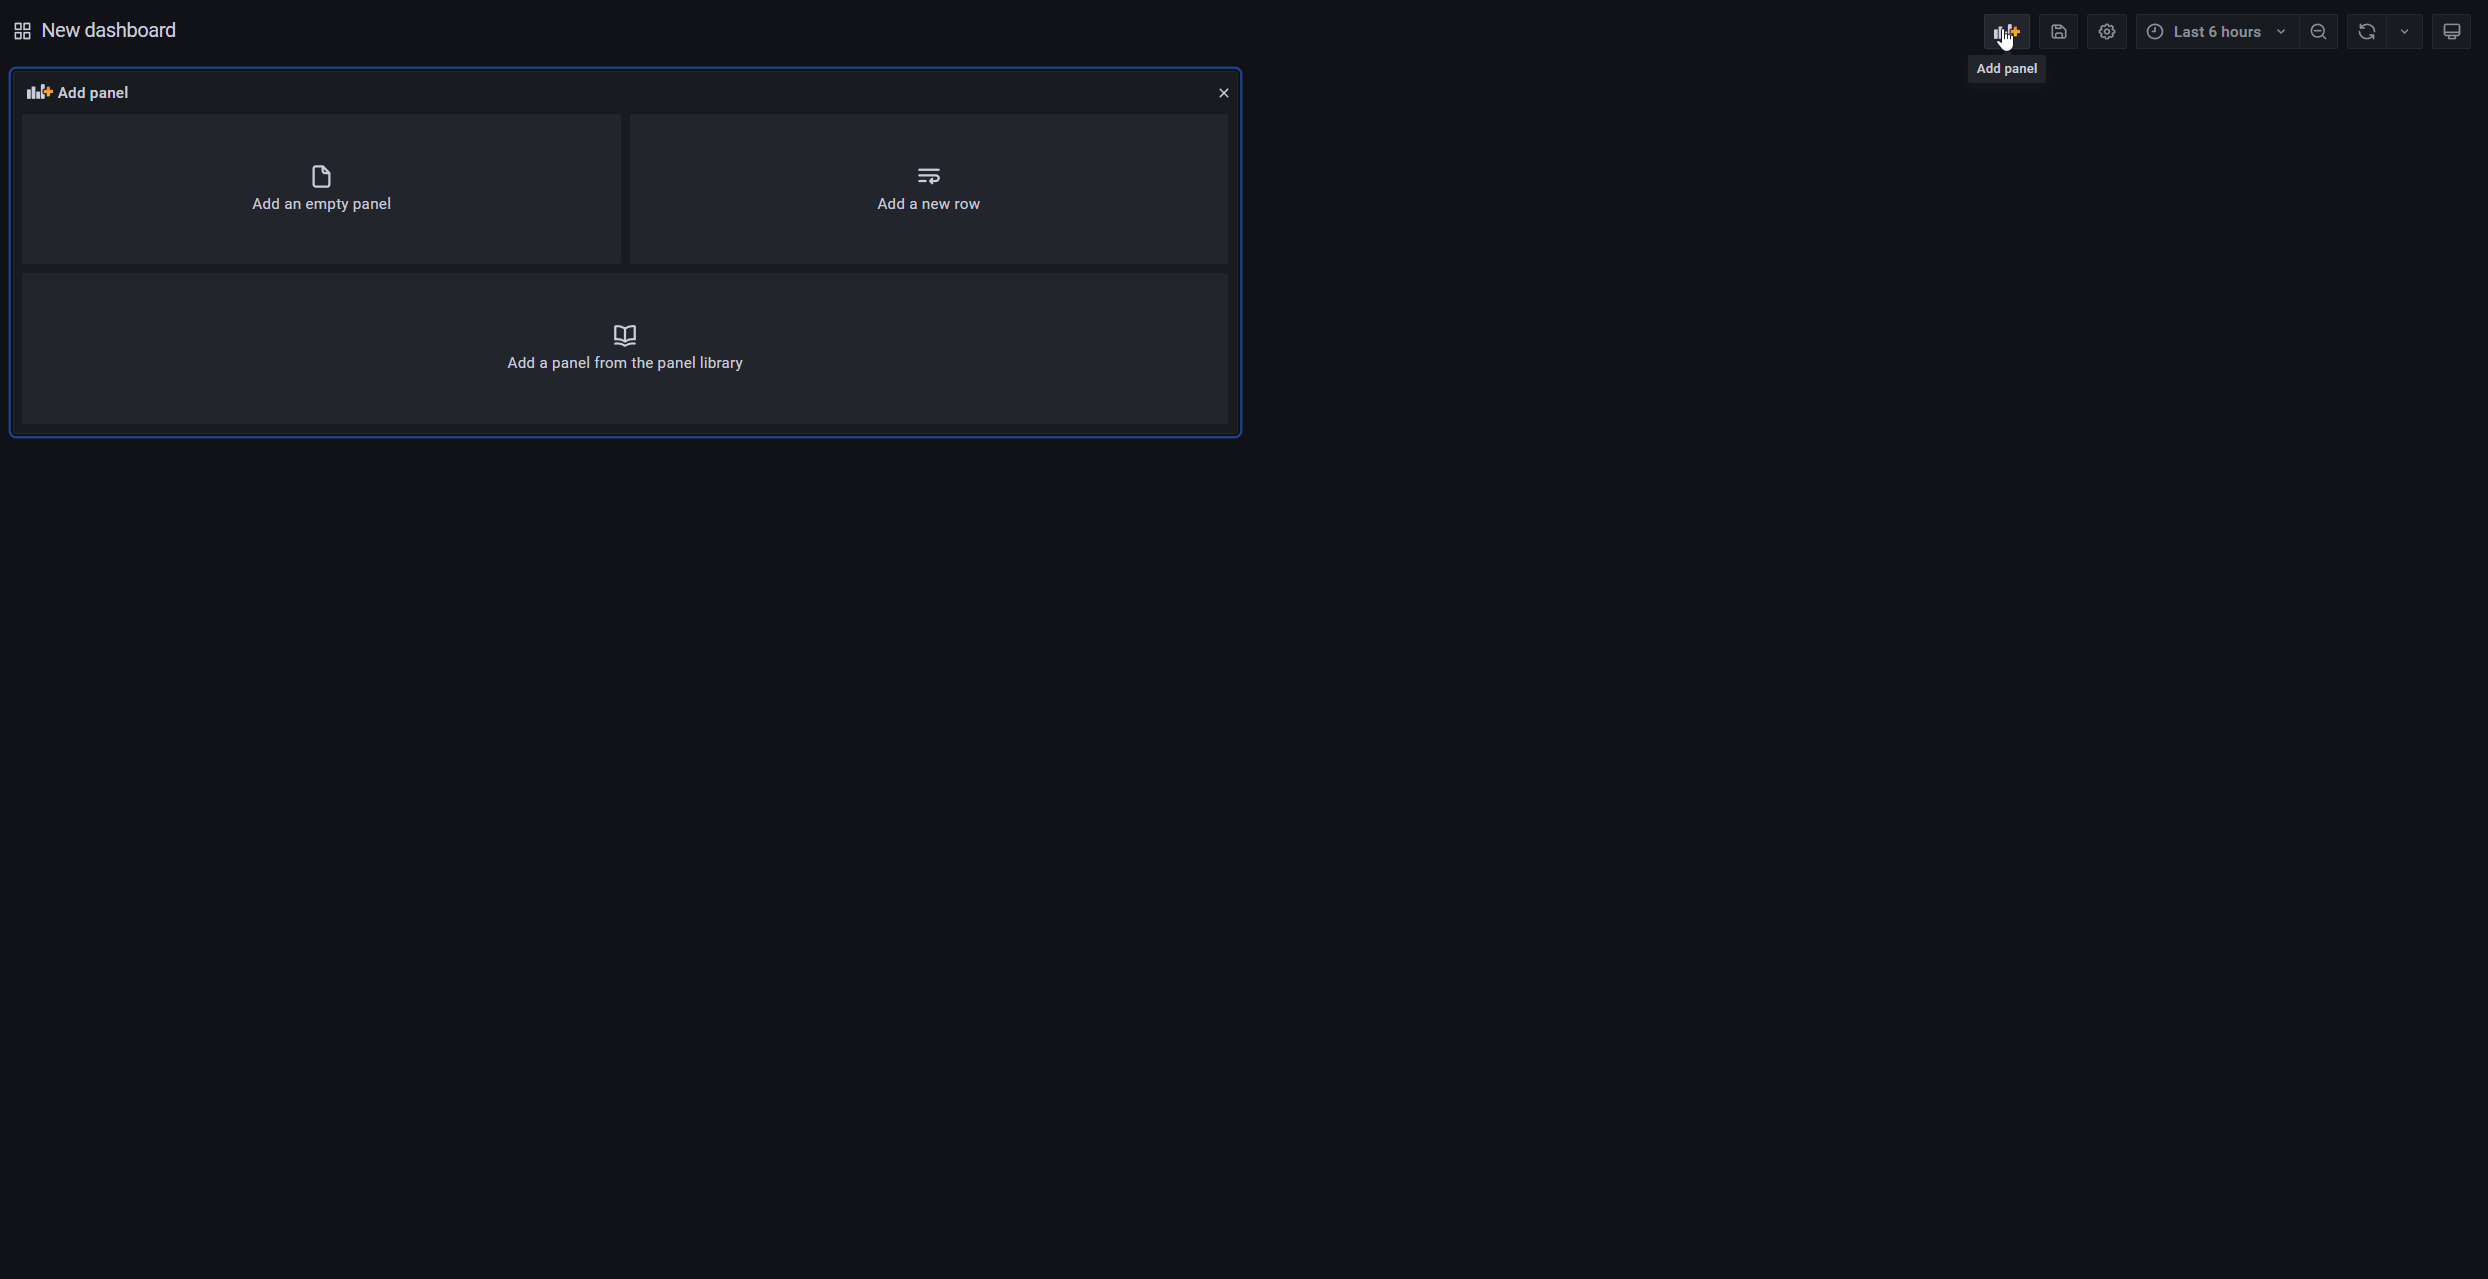
Now you can add different panels to your dashboard.
Example panel No.1: Number of produced pieces acquired by the light barrier
For the light barrier sensor, we are going to use the stat panel.
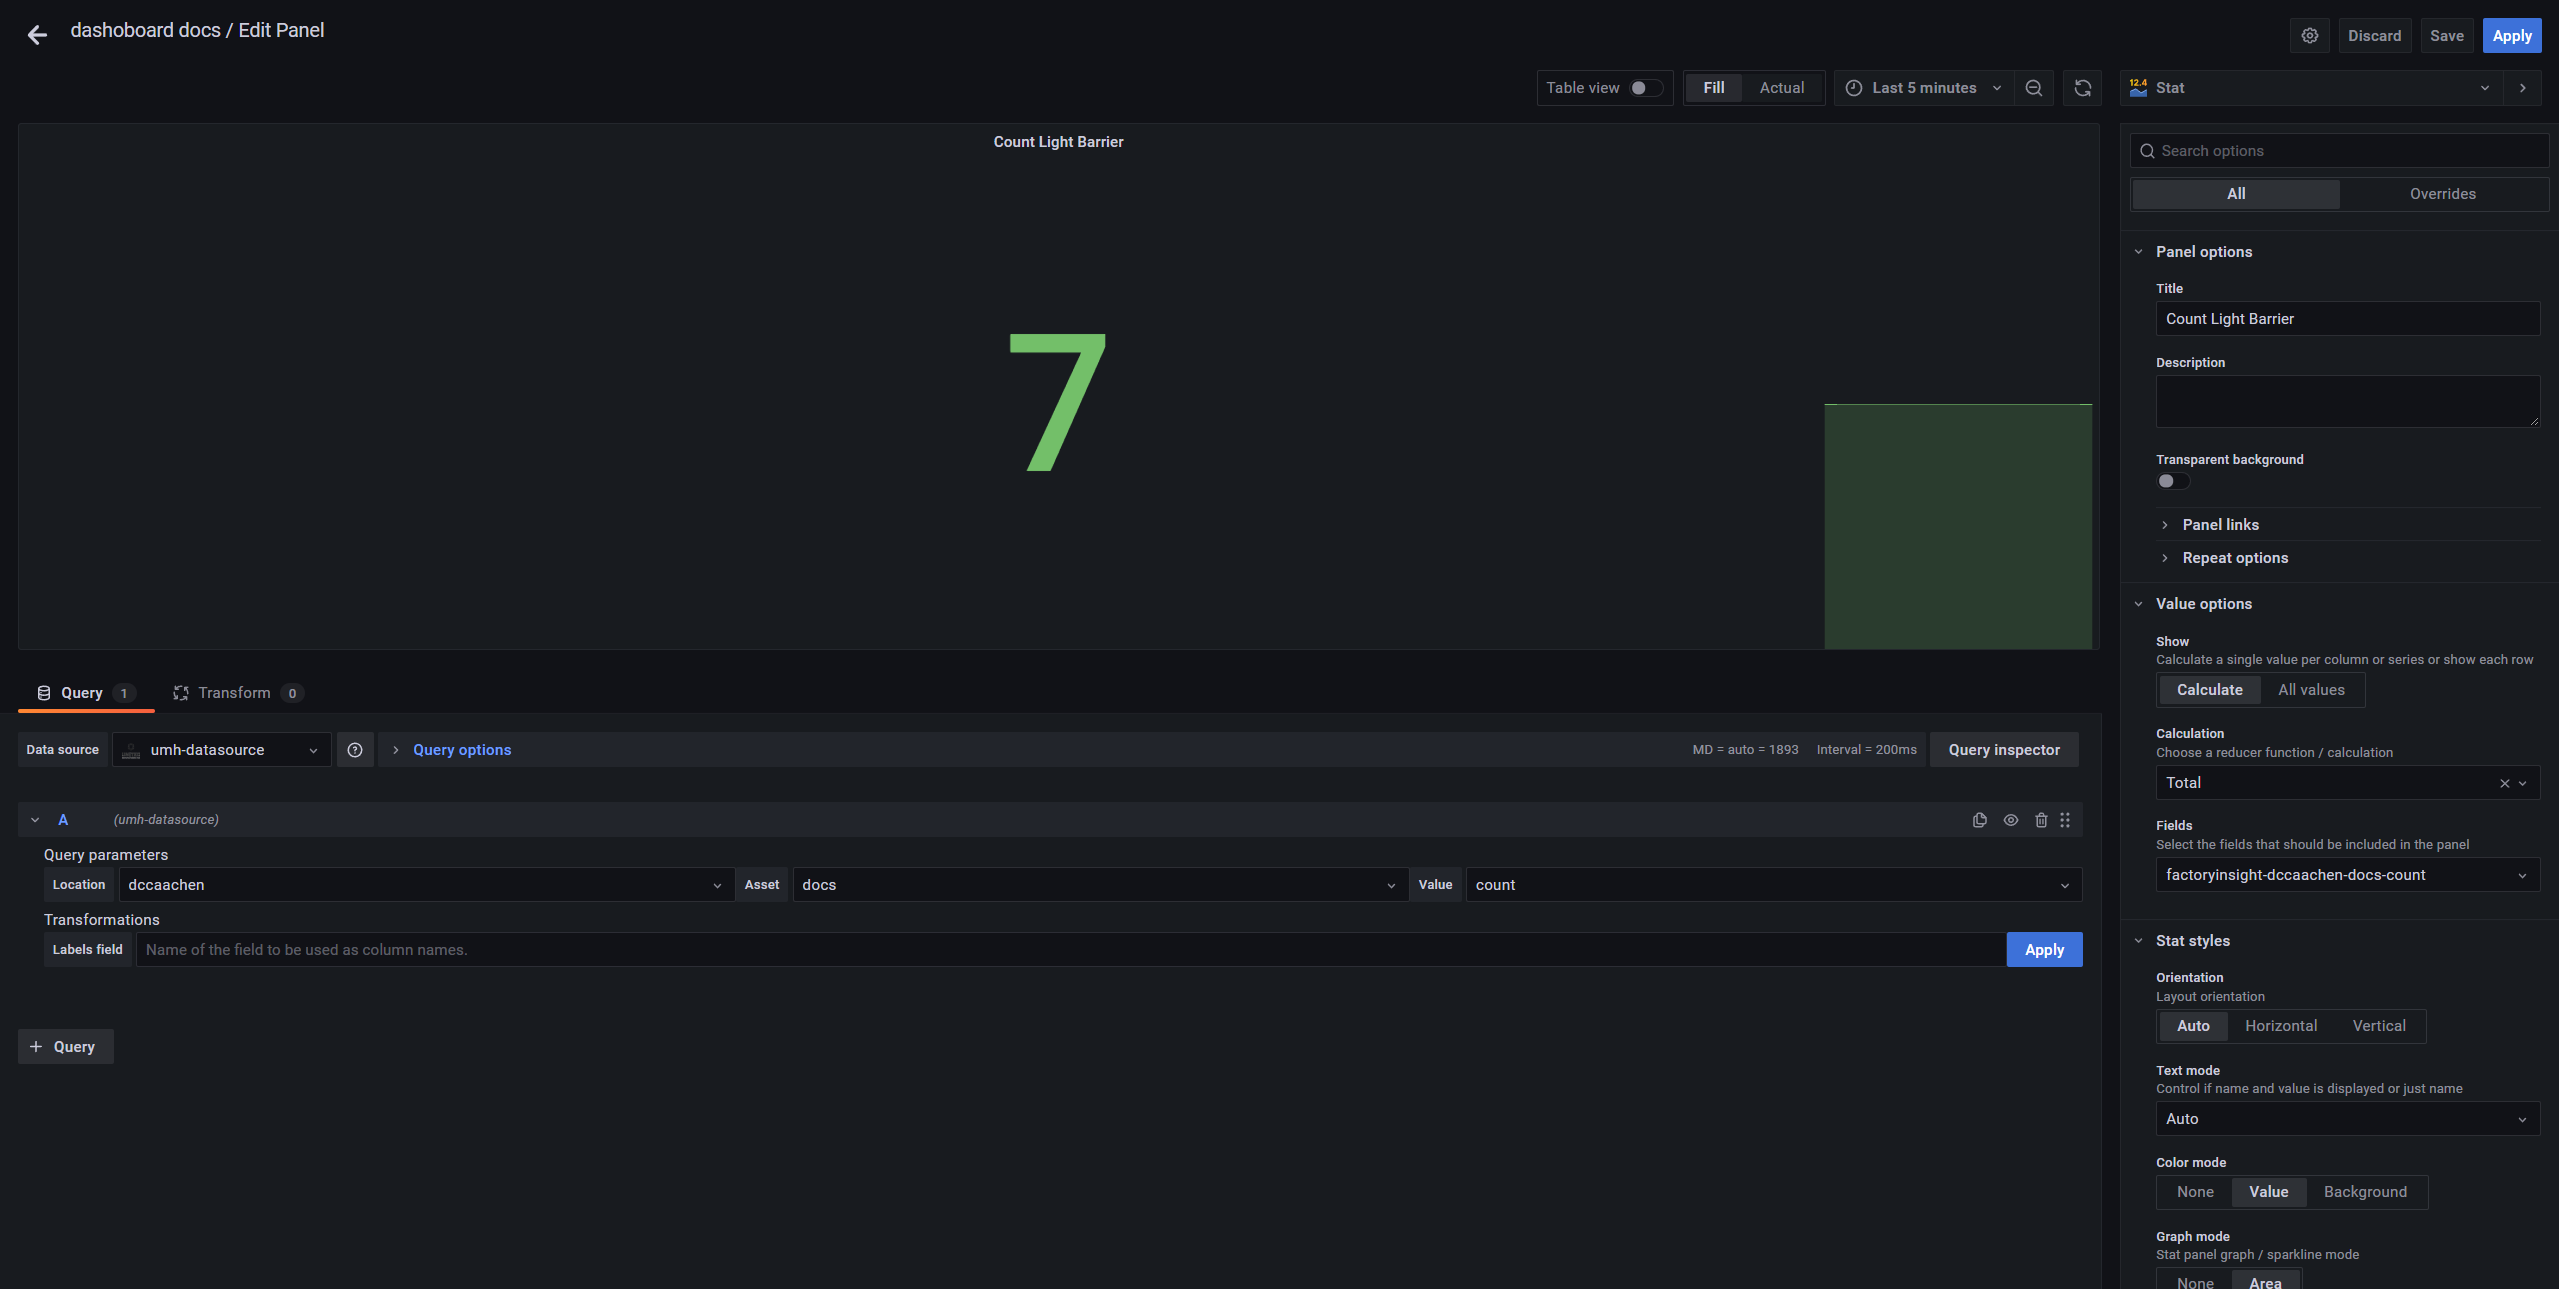
First of all, “location” and “asset” are selected from the topic of the second function in the Node-RED flow. The “Value” needs to be count.
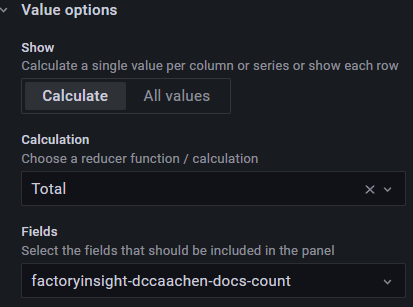
To get the total amount of produced parts a deeper insight into the panel settings is required. Go to “Value-Options” on the right side and change the entries of “Calculation” and “Fields” as shown below.
Example panel 2: machine state acquired by the button bar
For the button bar the Discrete panel is used.
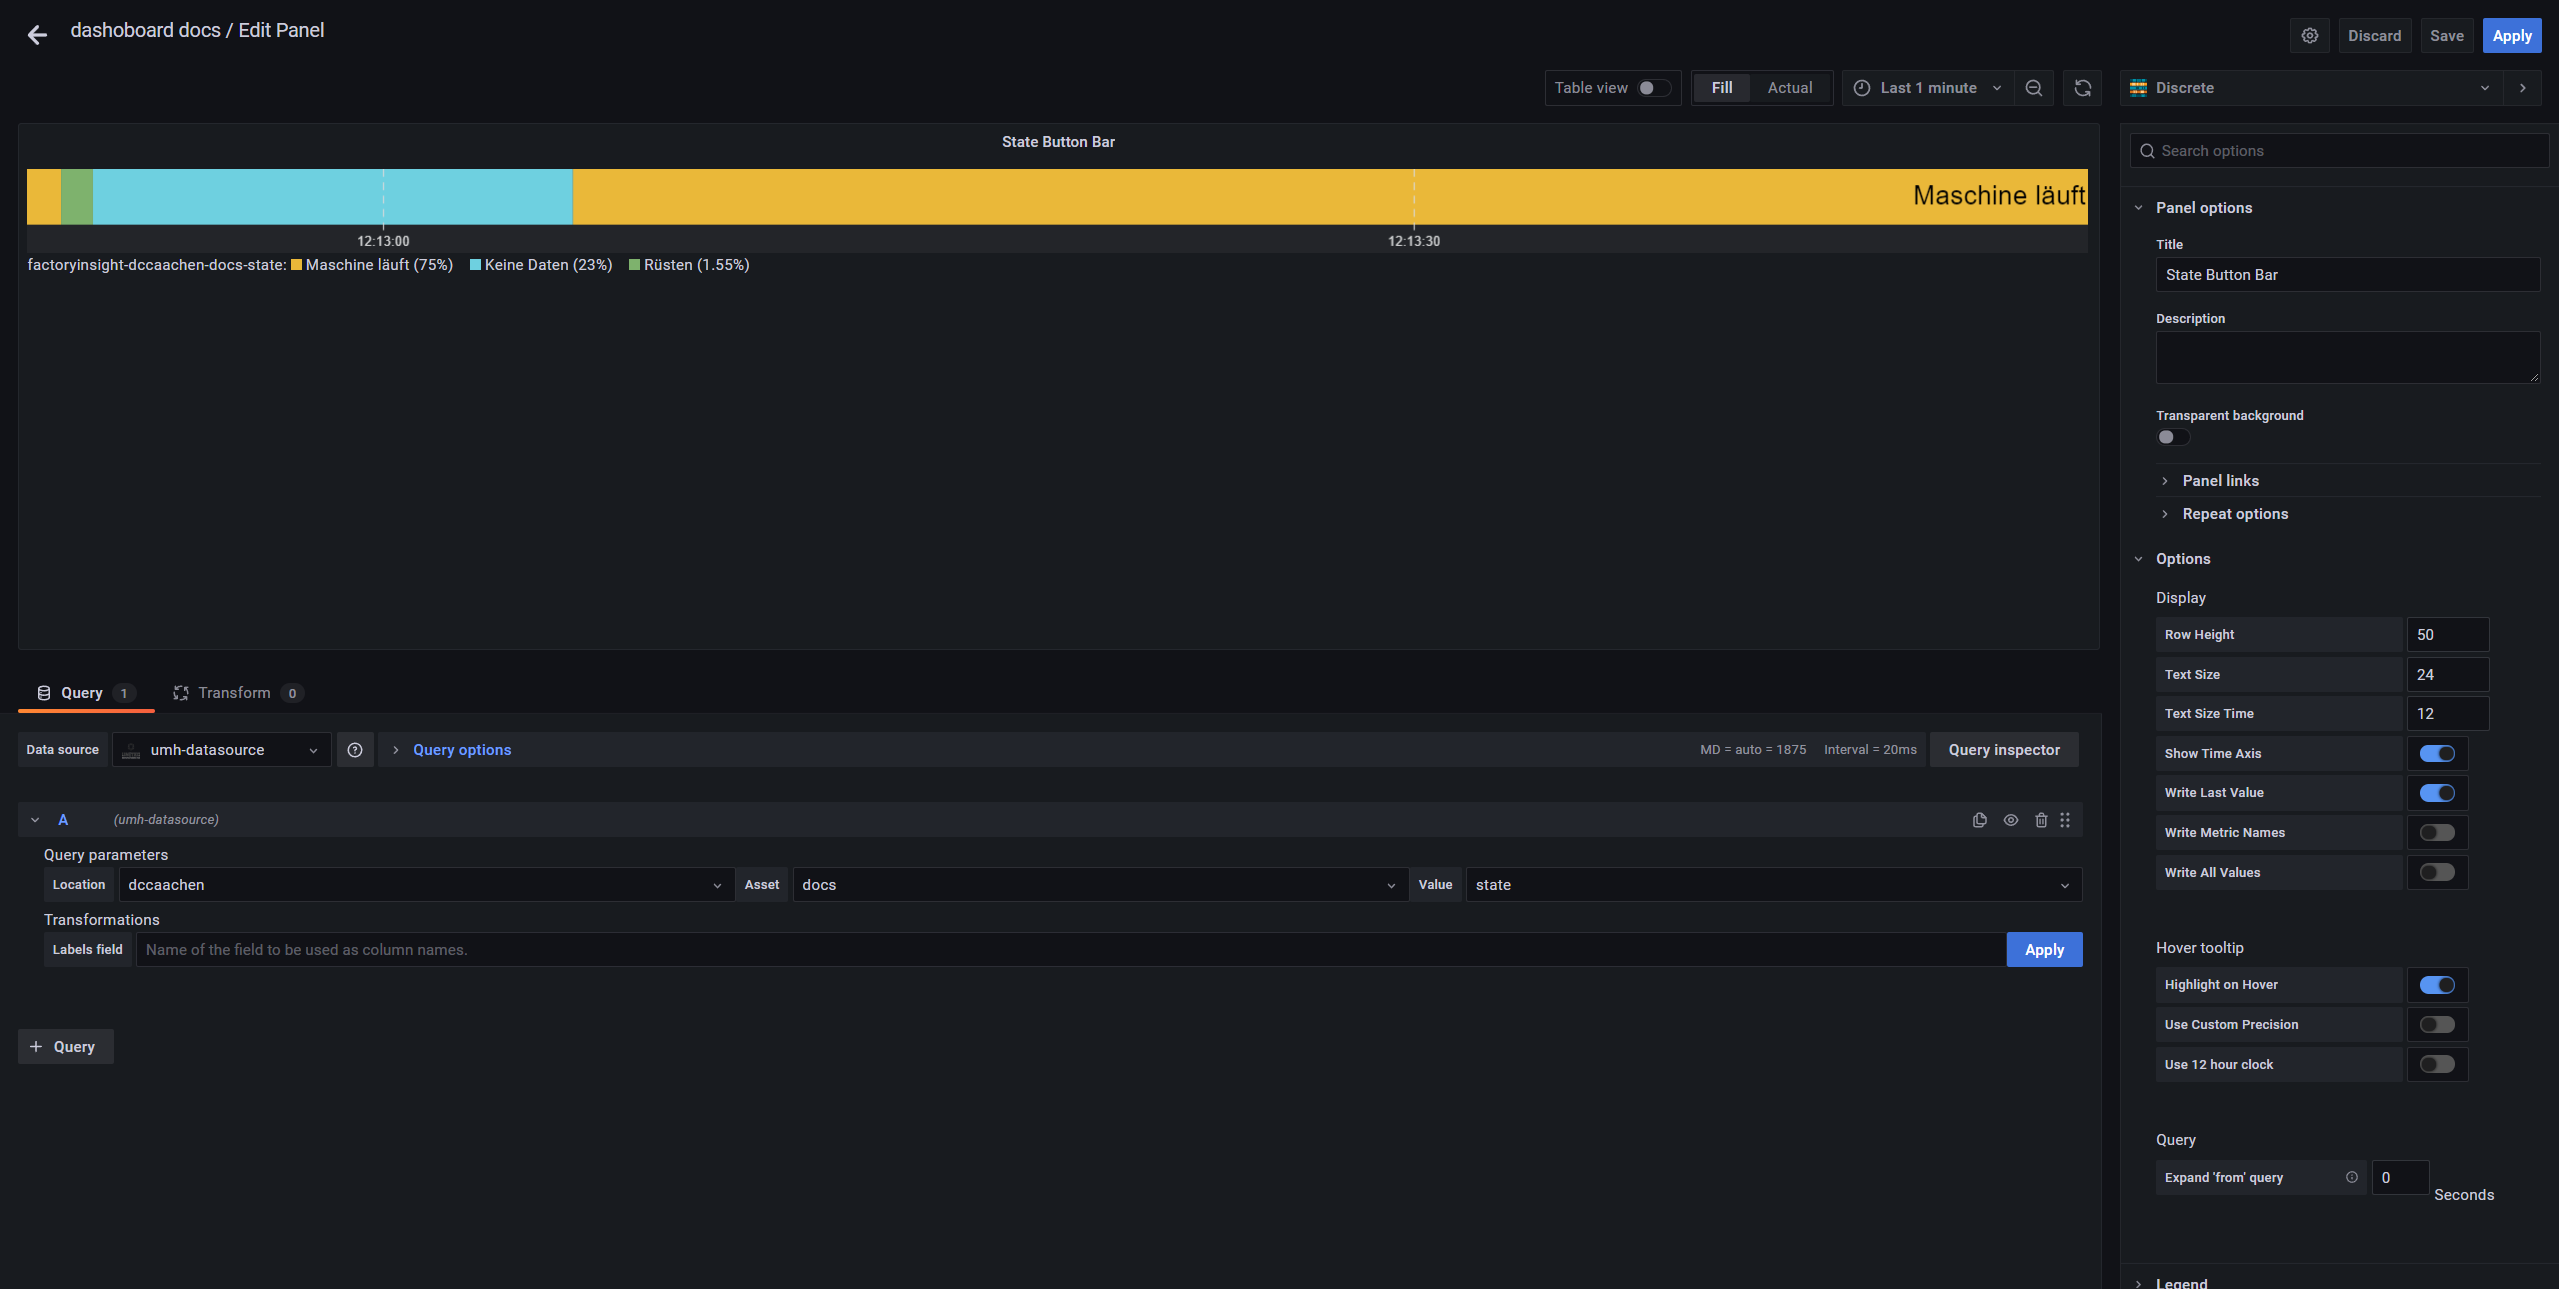
The query parameters from the topic of the second function in the Node-RED flow must be selected in “location” and “asset”. The value must be state.
Example panel 3: process values
For the capacitive sensor the Graph (old) panel is used.
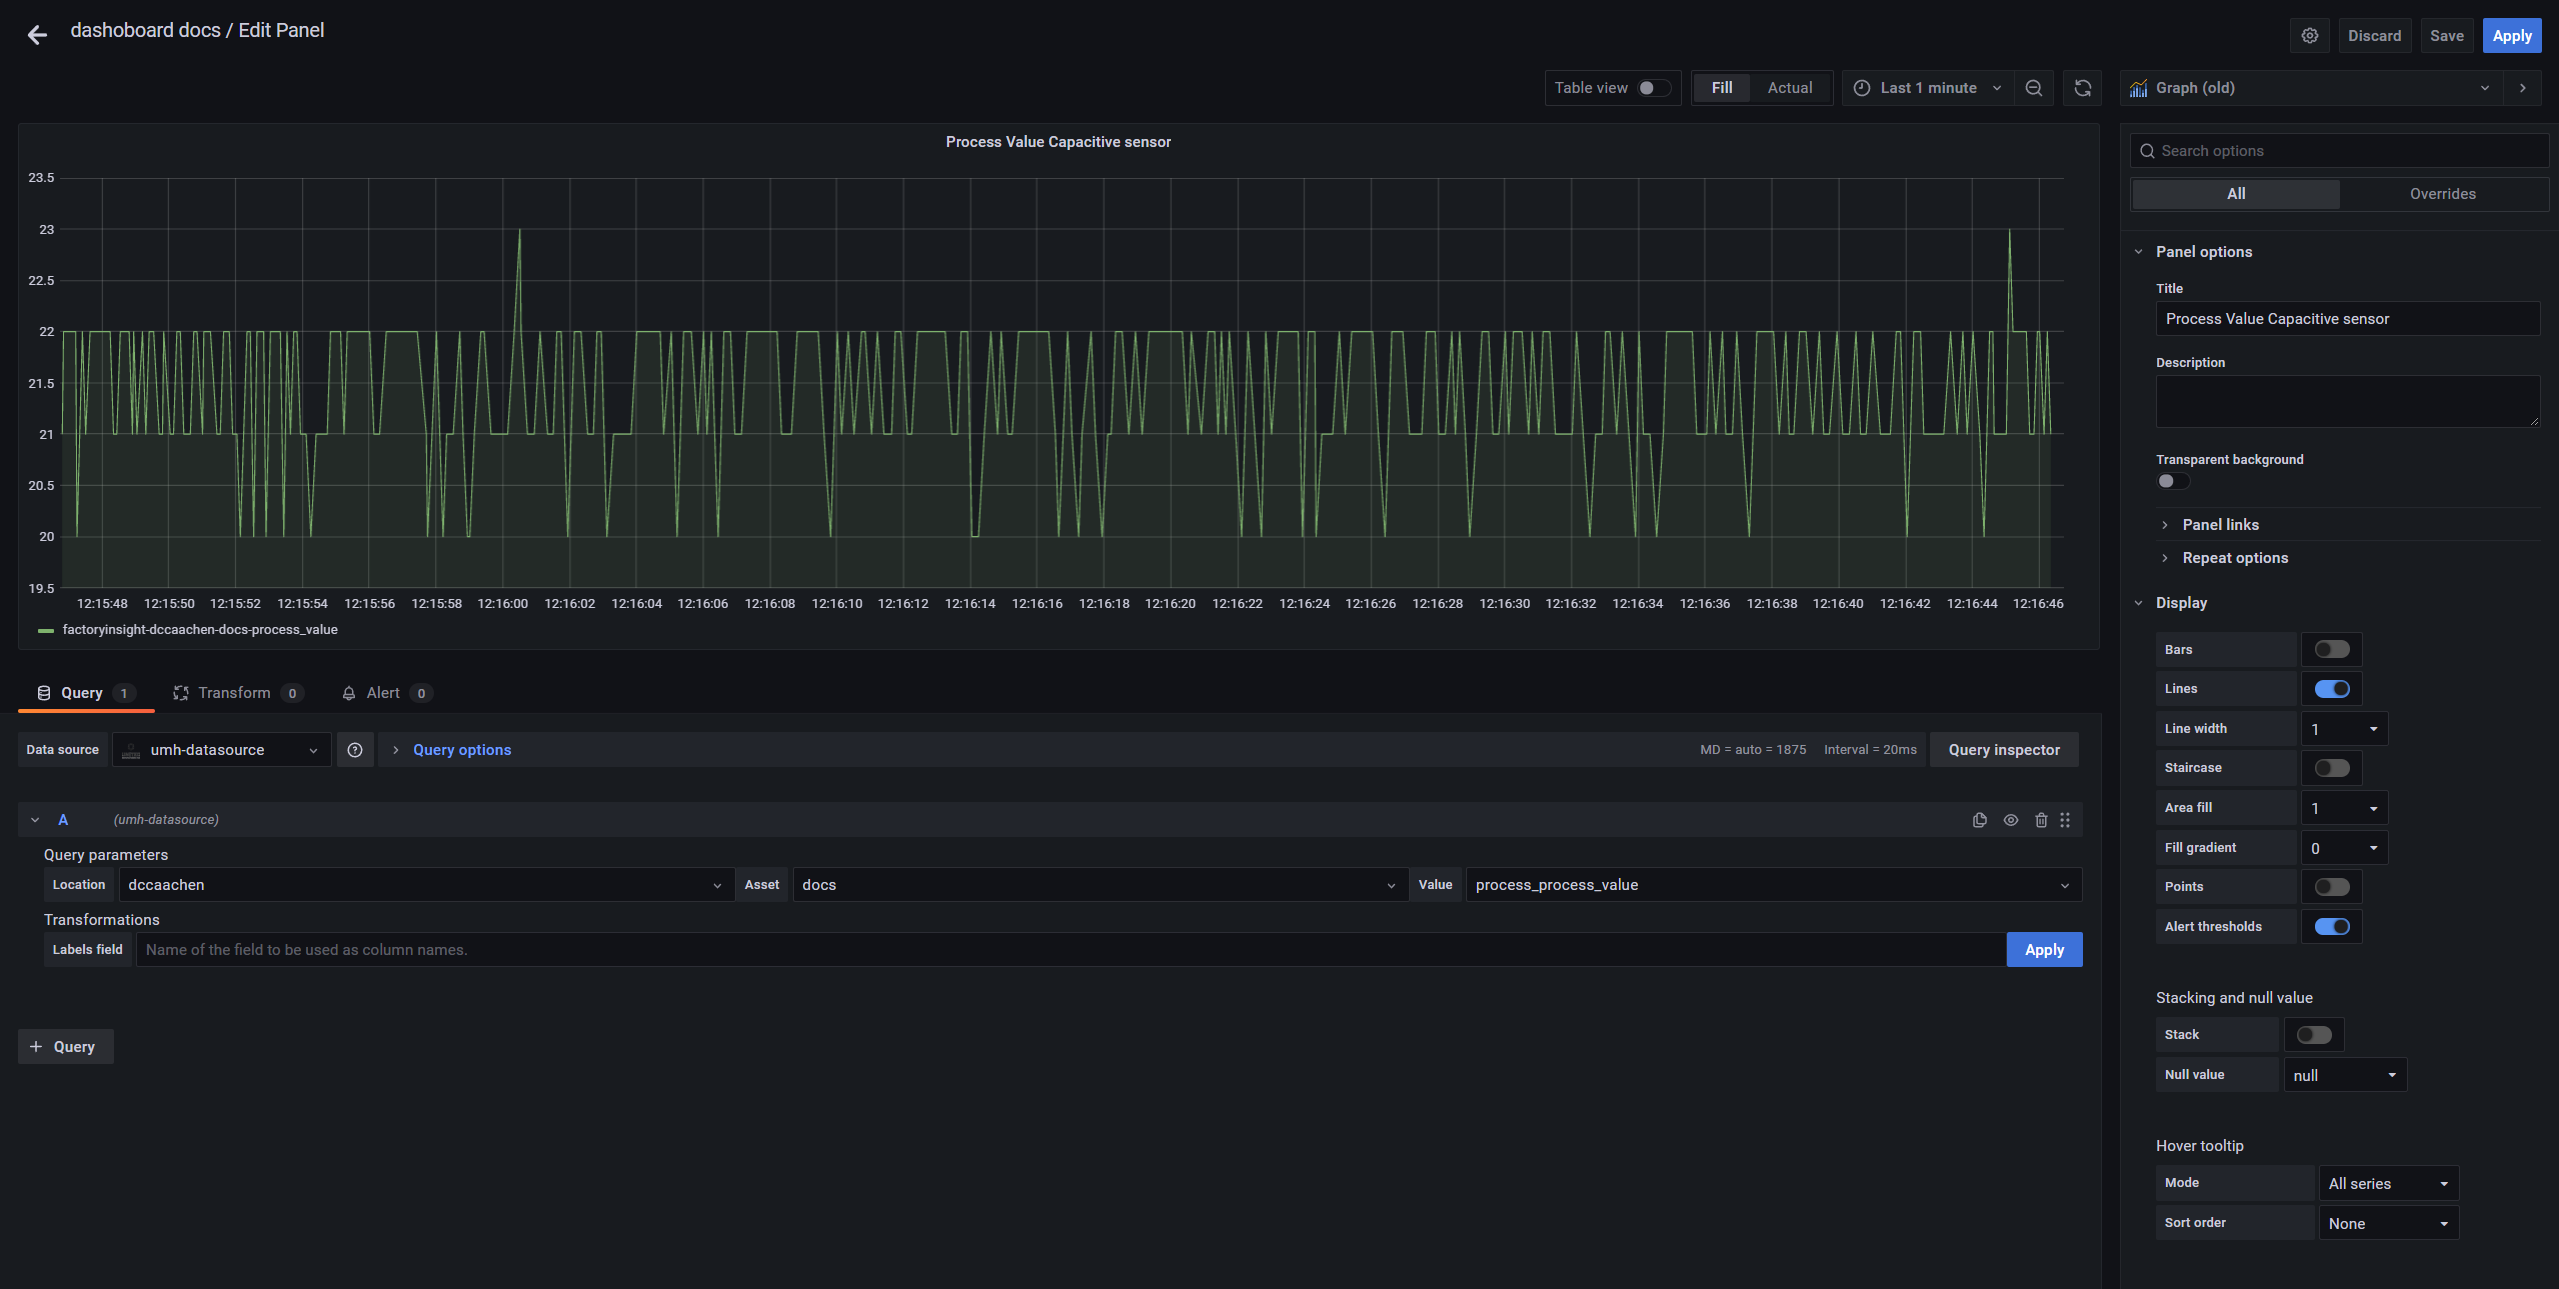
The query parameters from the topic of the second function in the Node-RED flow must be selected in “location and “asset. The “value” must be the process value as specified in the payload message during the Node-RED tutorial.
Now the dashboard should look like this. In the upper right corner you can set the time span in which the data should be displayed and how often the dashboard should be refreshed.

What’s next?
Please return to the Getting Started Section and don’t forget to give us feedback.