Setting up the MQTT broker to see MQTT-messages
There are two options to see your messages in MQTT
less than a minute
Instructions
In general, there are two options. Option 1 is for quick fixes when working with Node-RED flows and Option 2 is more sophisticated.
Option 1: in Node-RED
…the thing with the debugger-node and the debugging-window.
Option 2: using MQTT Explorer
In this article we shortly explain how you can set up all machines and servers through the MQTT-Explorer. This is mandatory to monitor MQTT-messages and troubleshoot if somehow data does not find its way to grafana.
Install MQTT Explorer
Open it and add a new connection
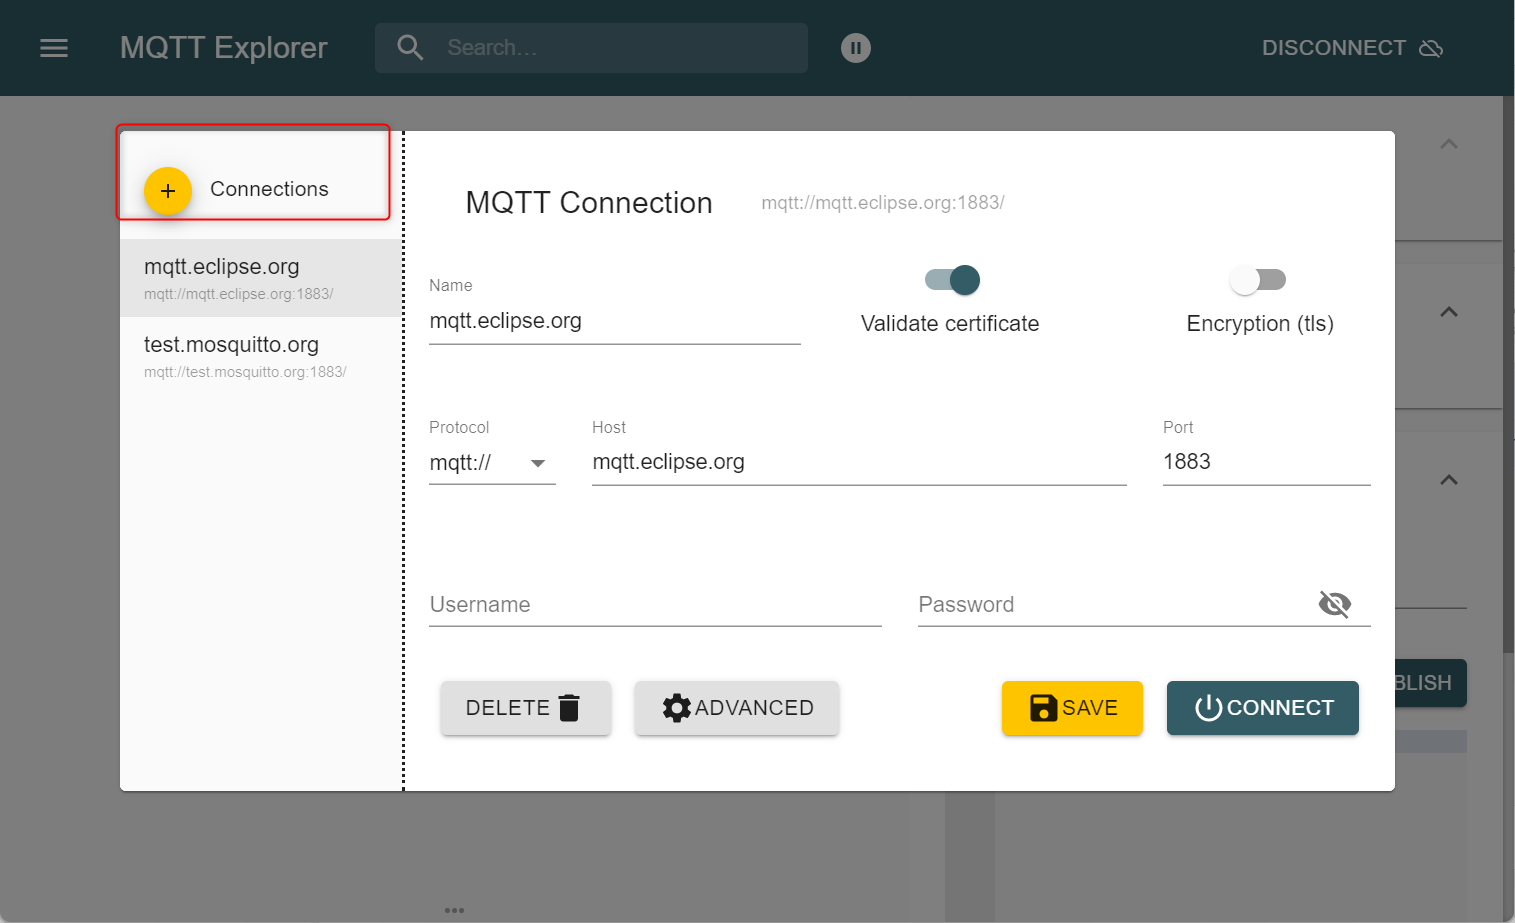
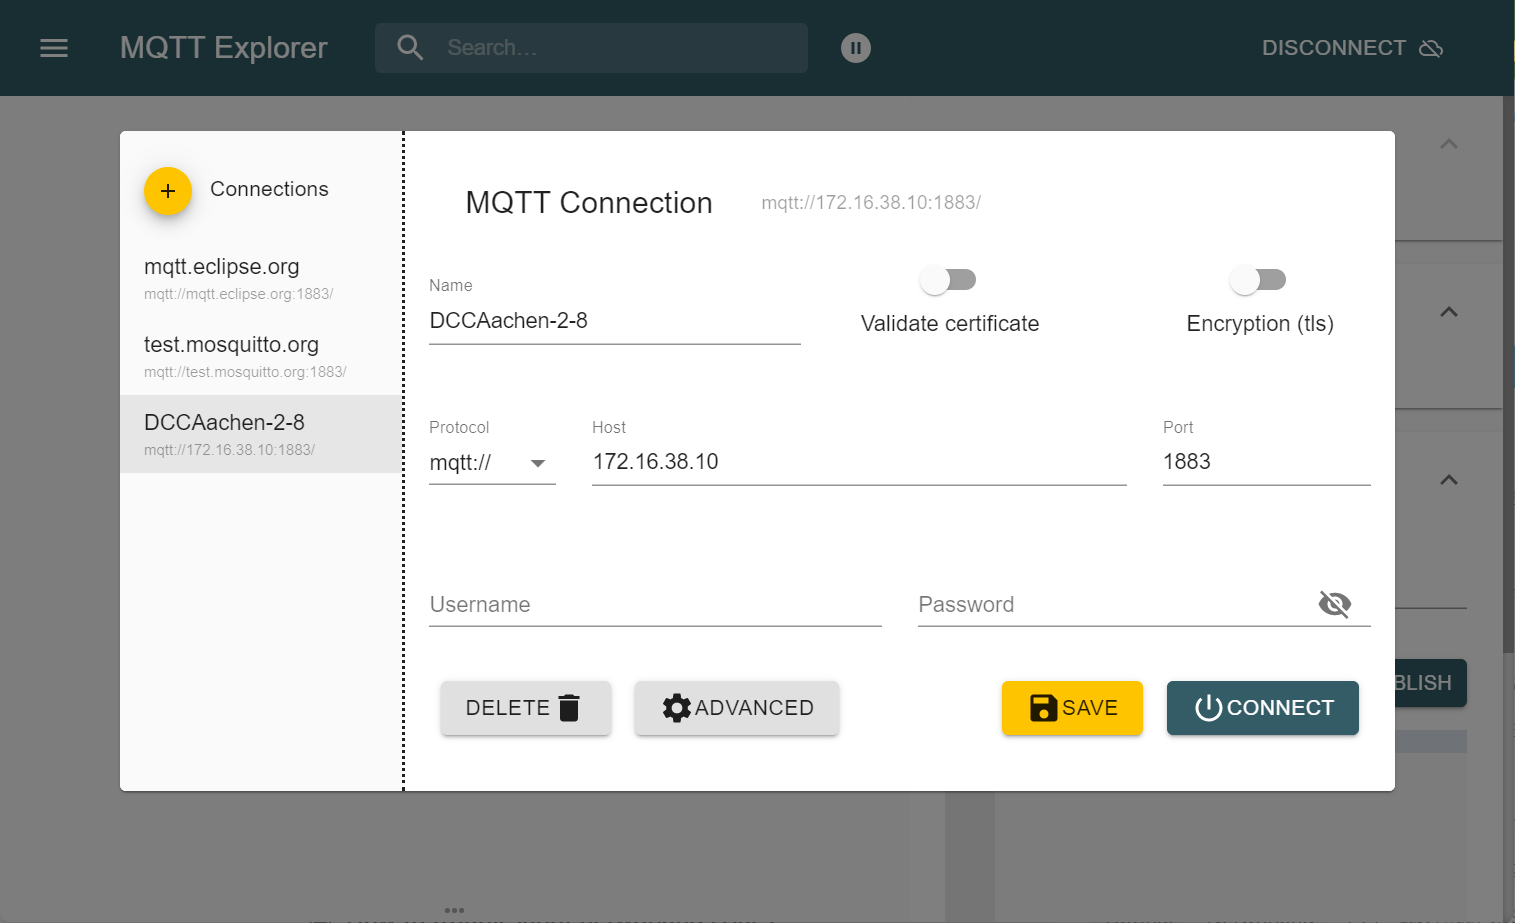
Give it a name and enter the IP address of the MQTT broker (usually the IP of the edge device)
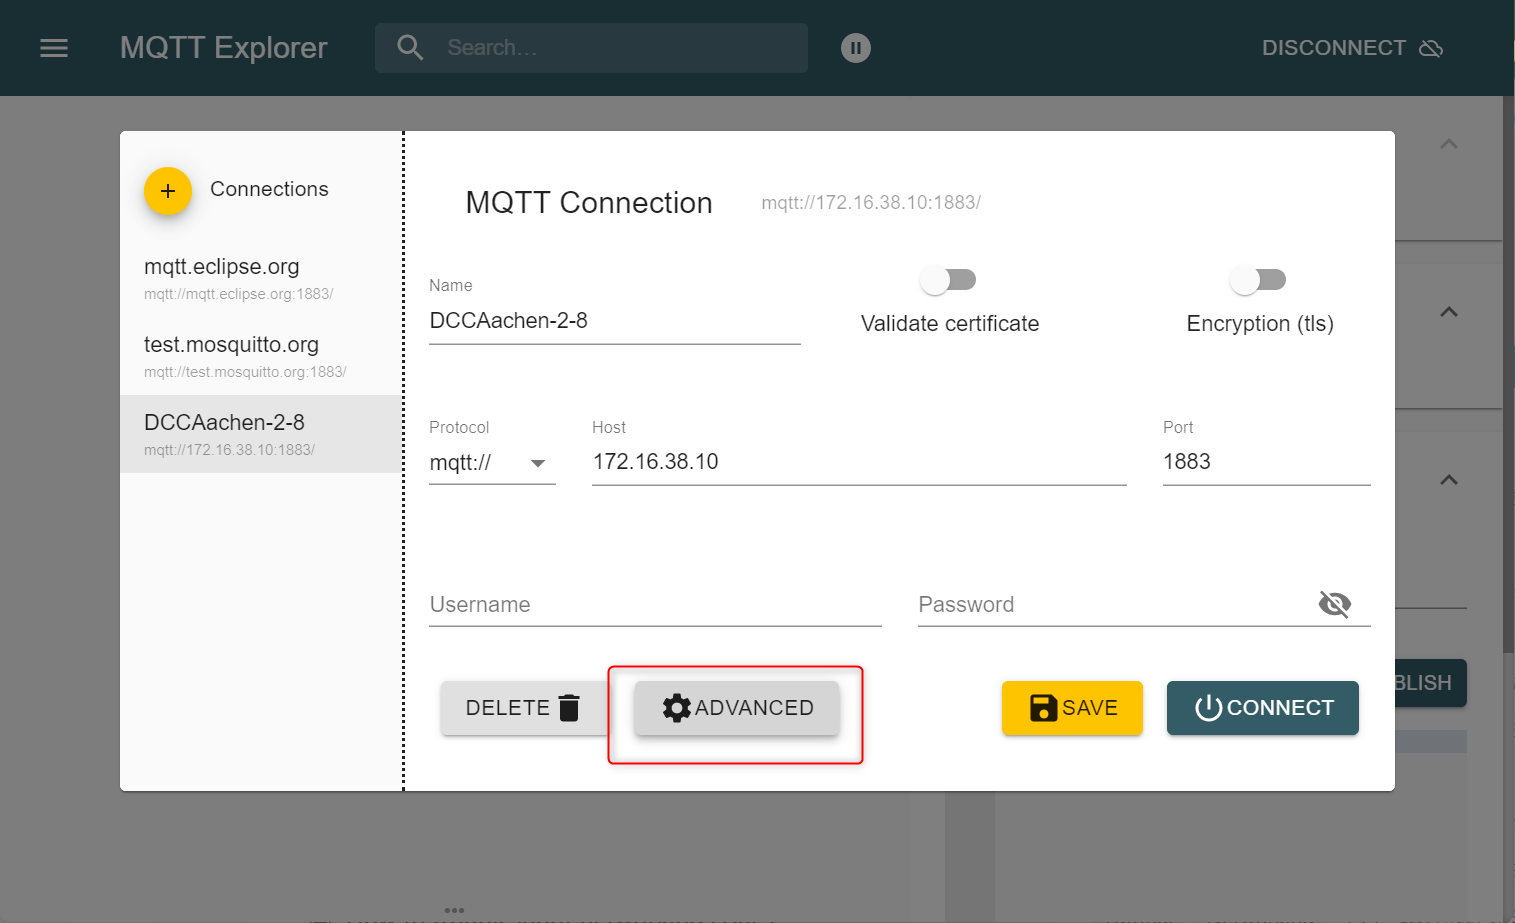
Go to Advanced
Remove the topic with #
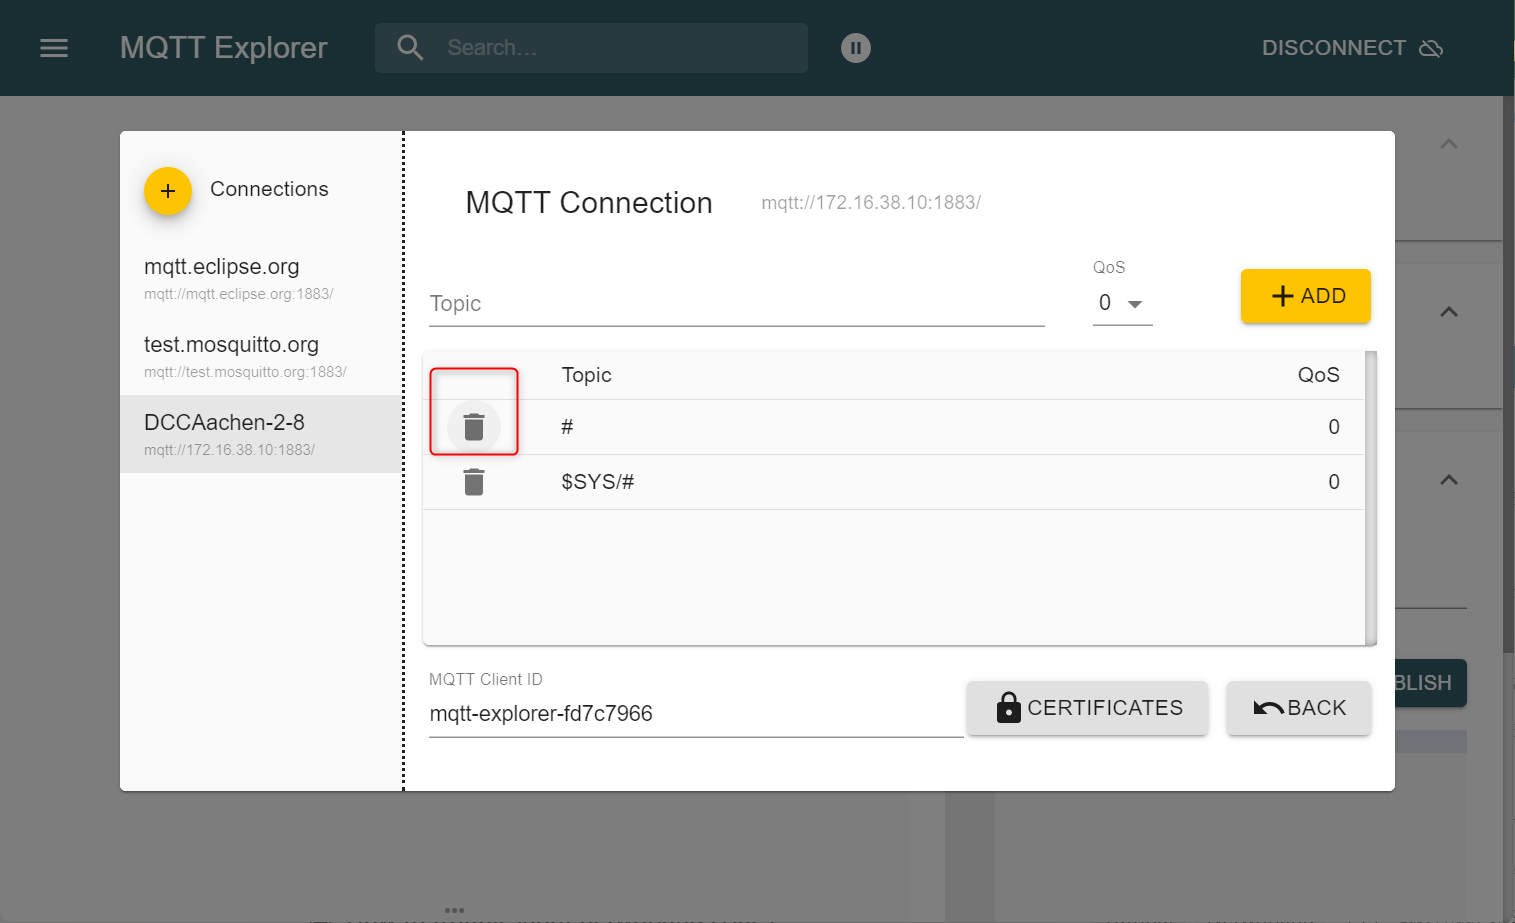
Create a new topic with ia/#
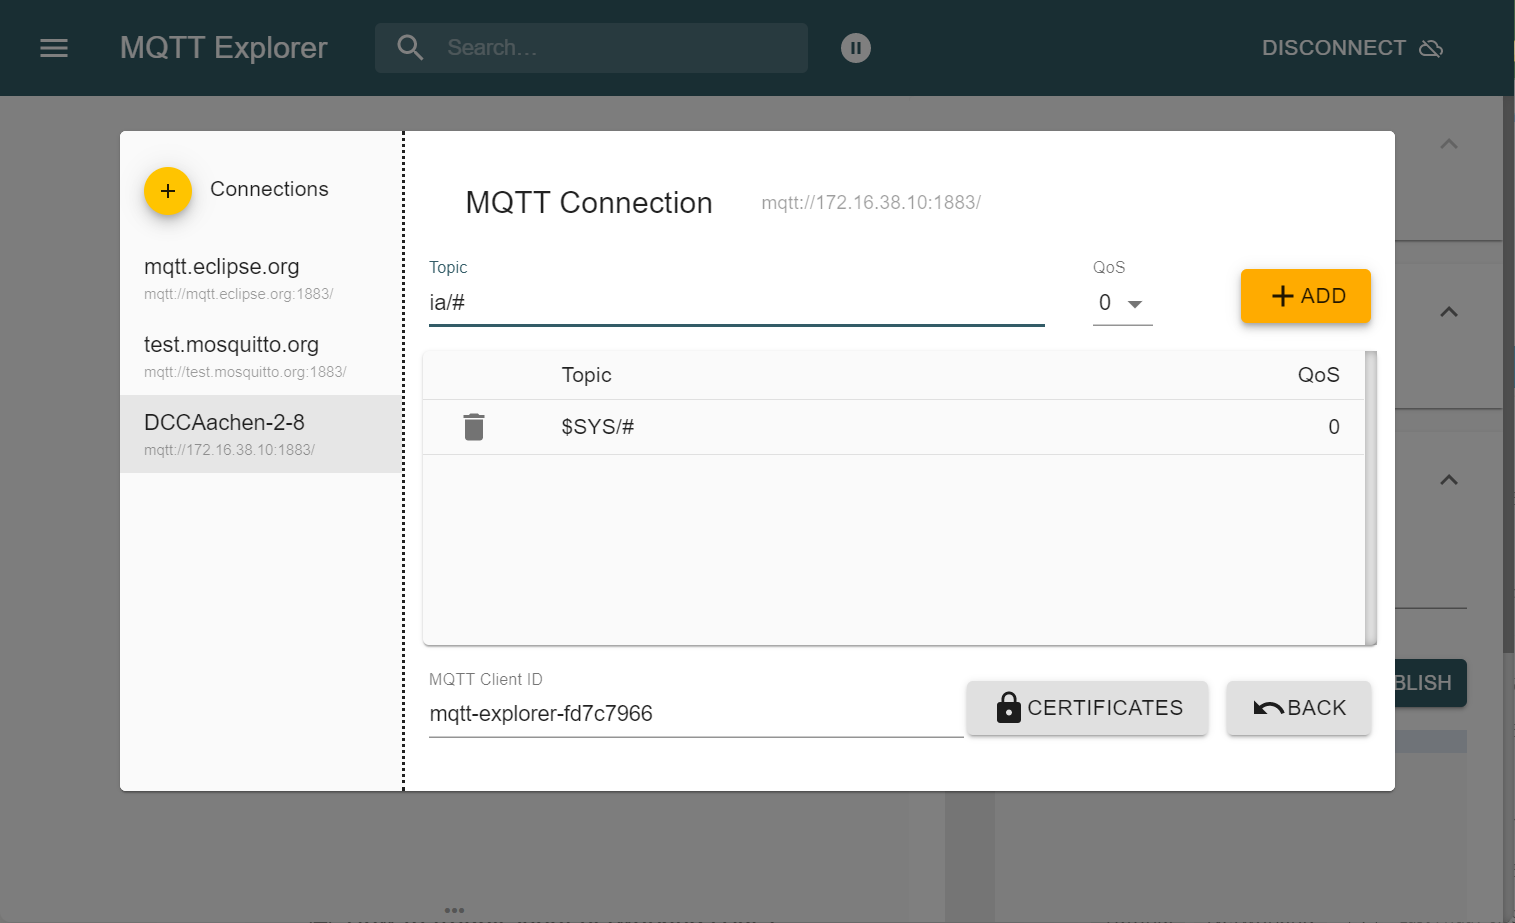
Press back and SAVE. then connect.
Last modified February 17, 2023: update (#208) (ea731fc)