How to use fgtrace
Tutorial on how to get started with fgtrace
less than a minute
Instructions
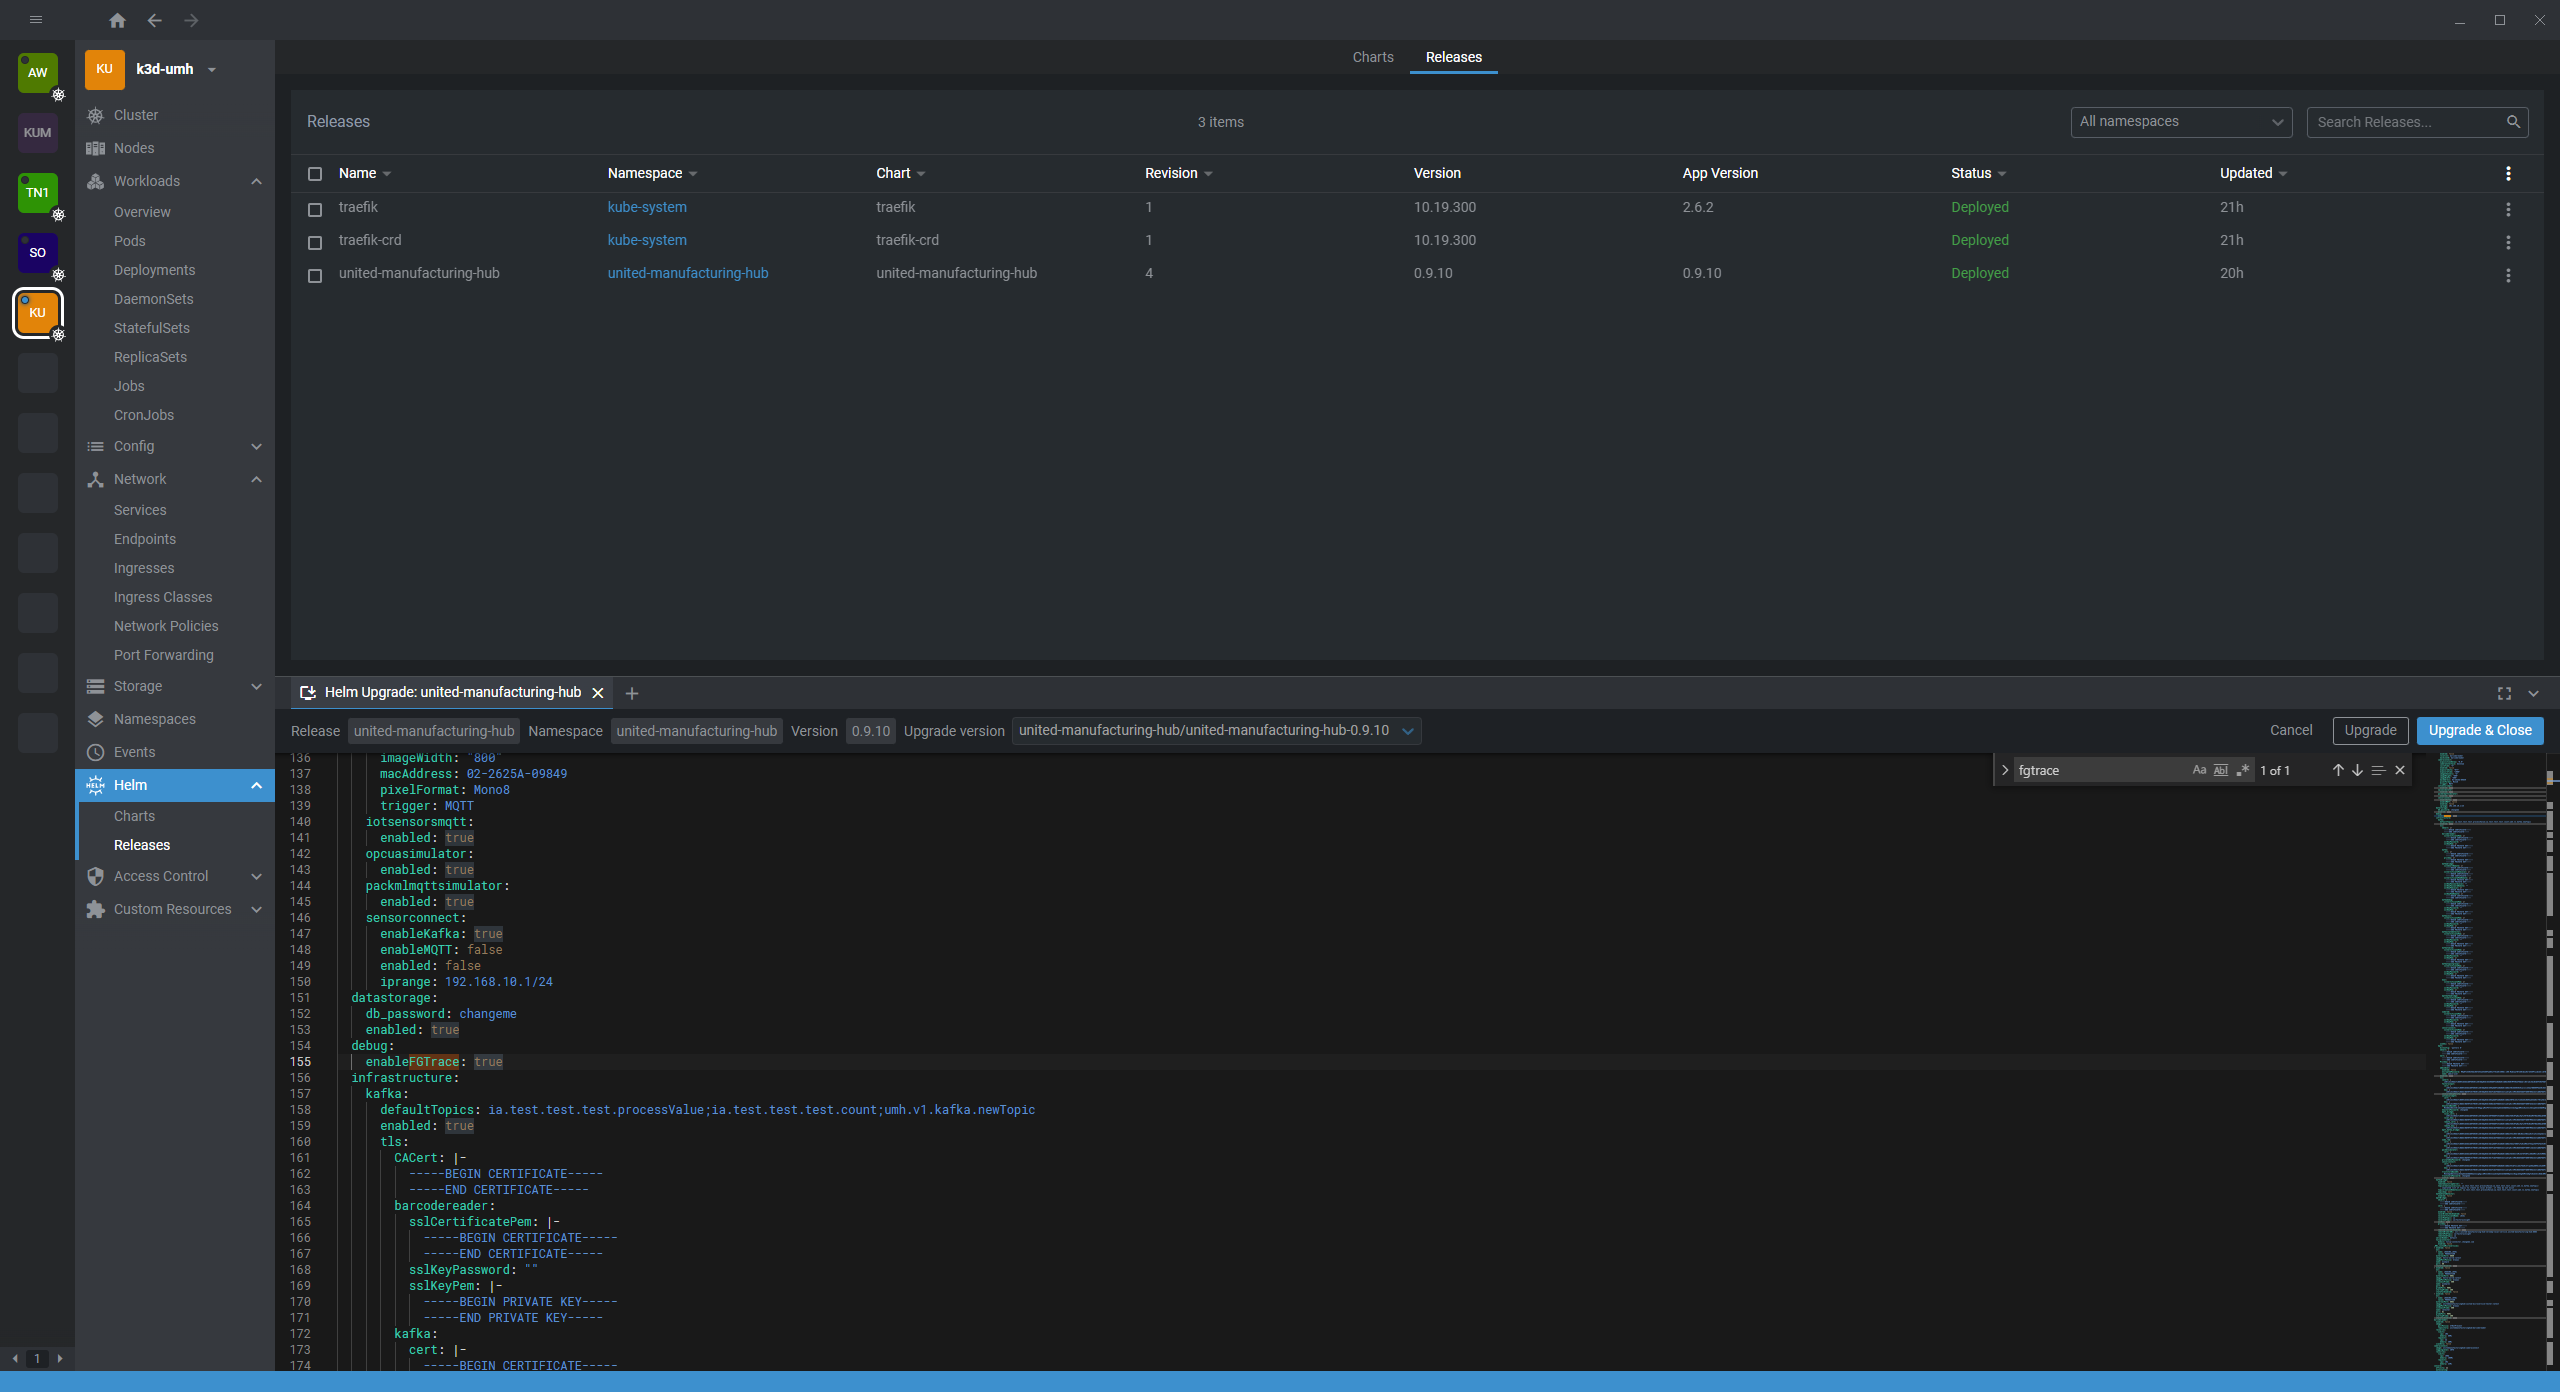
Enable fgtrace
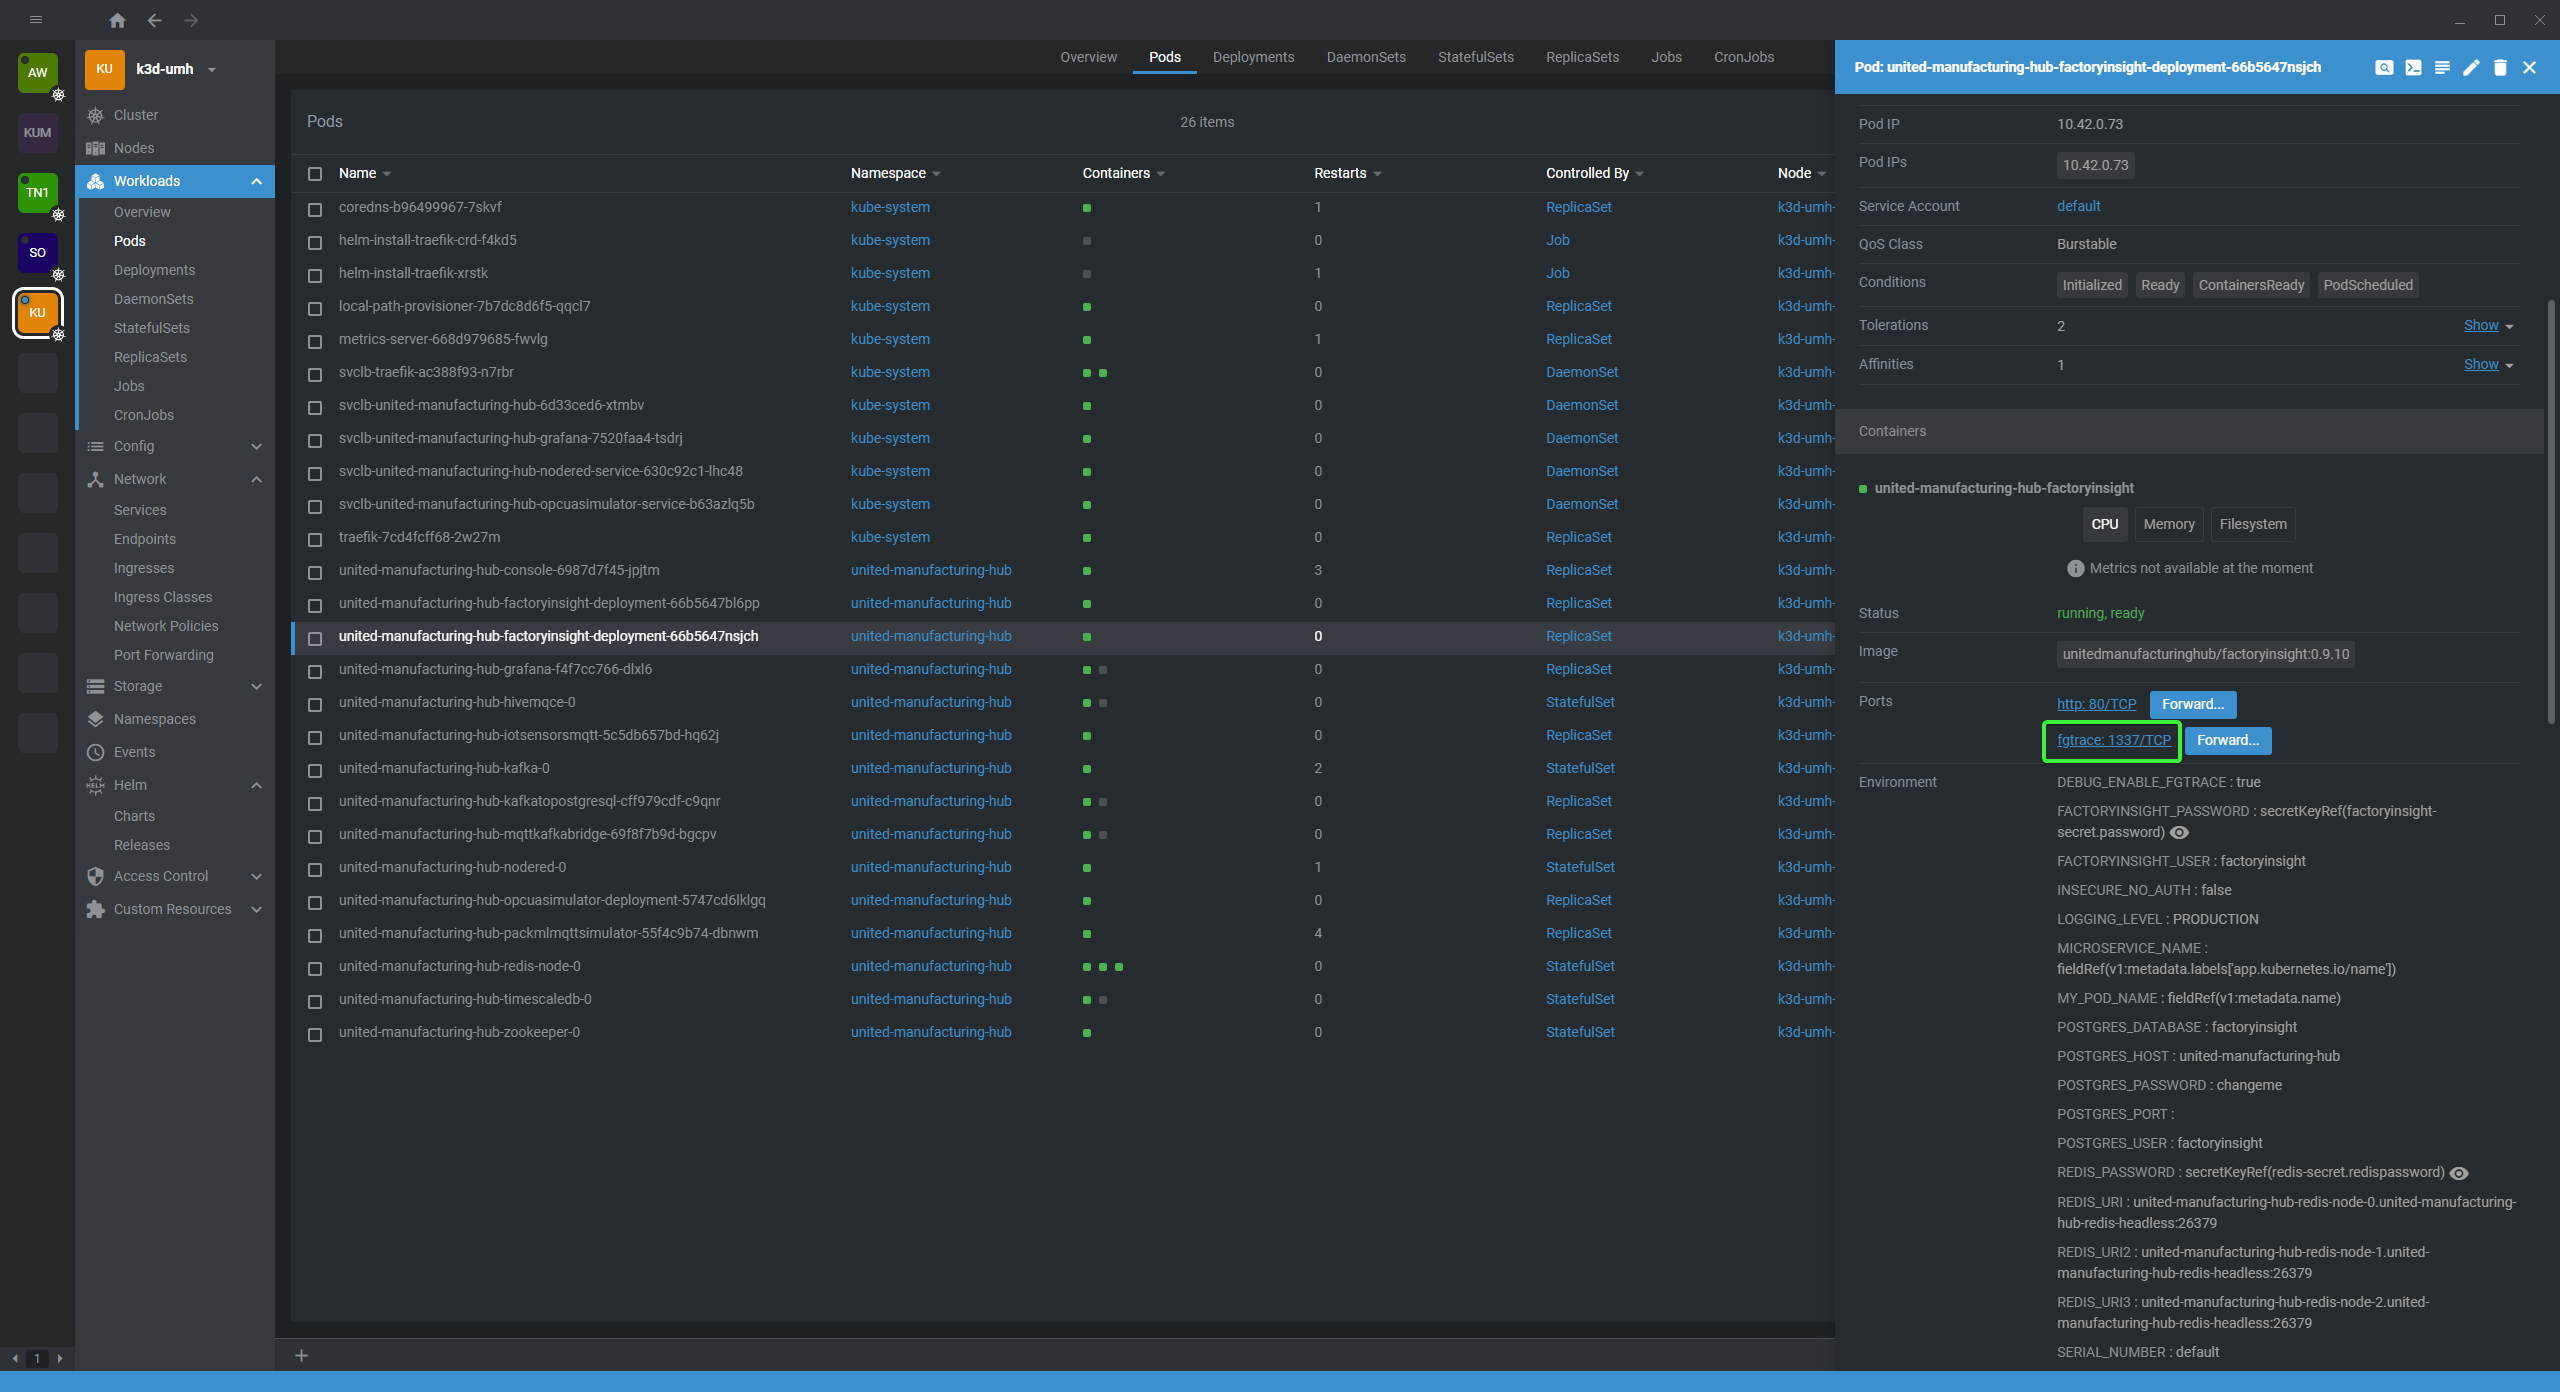
Forward the new fgtrace port
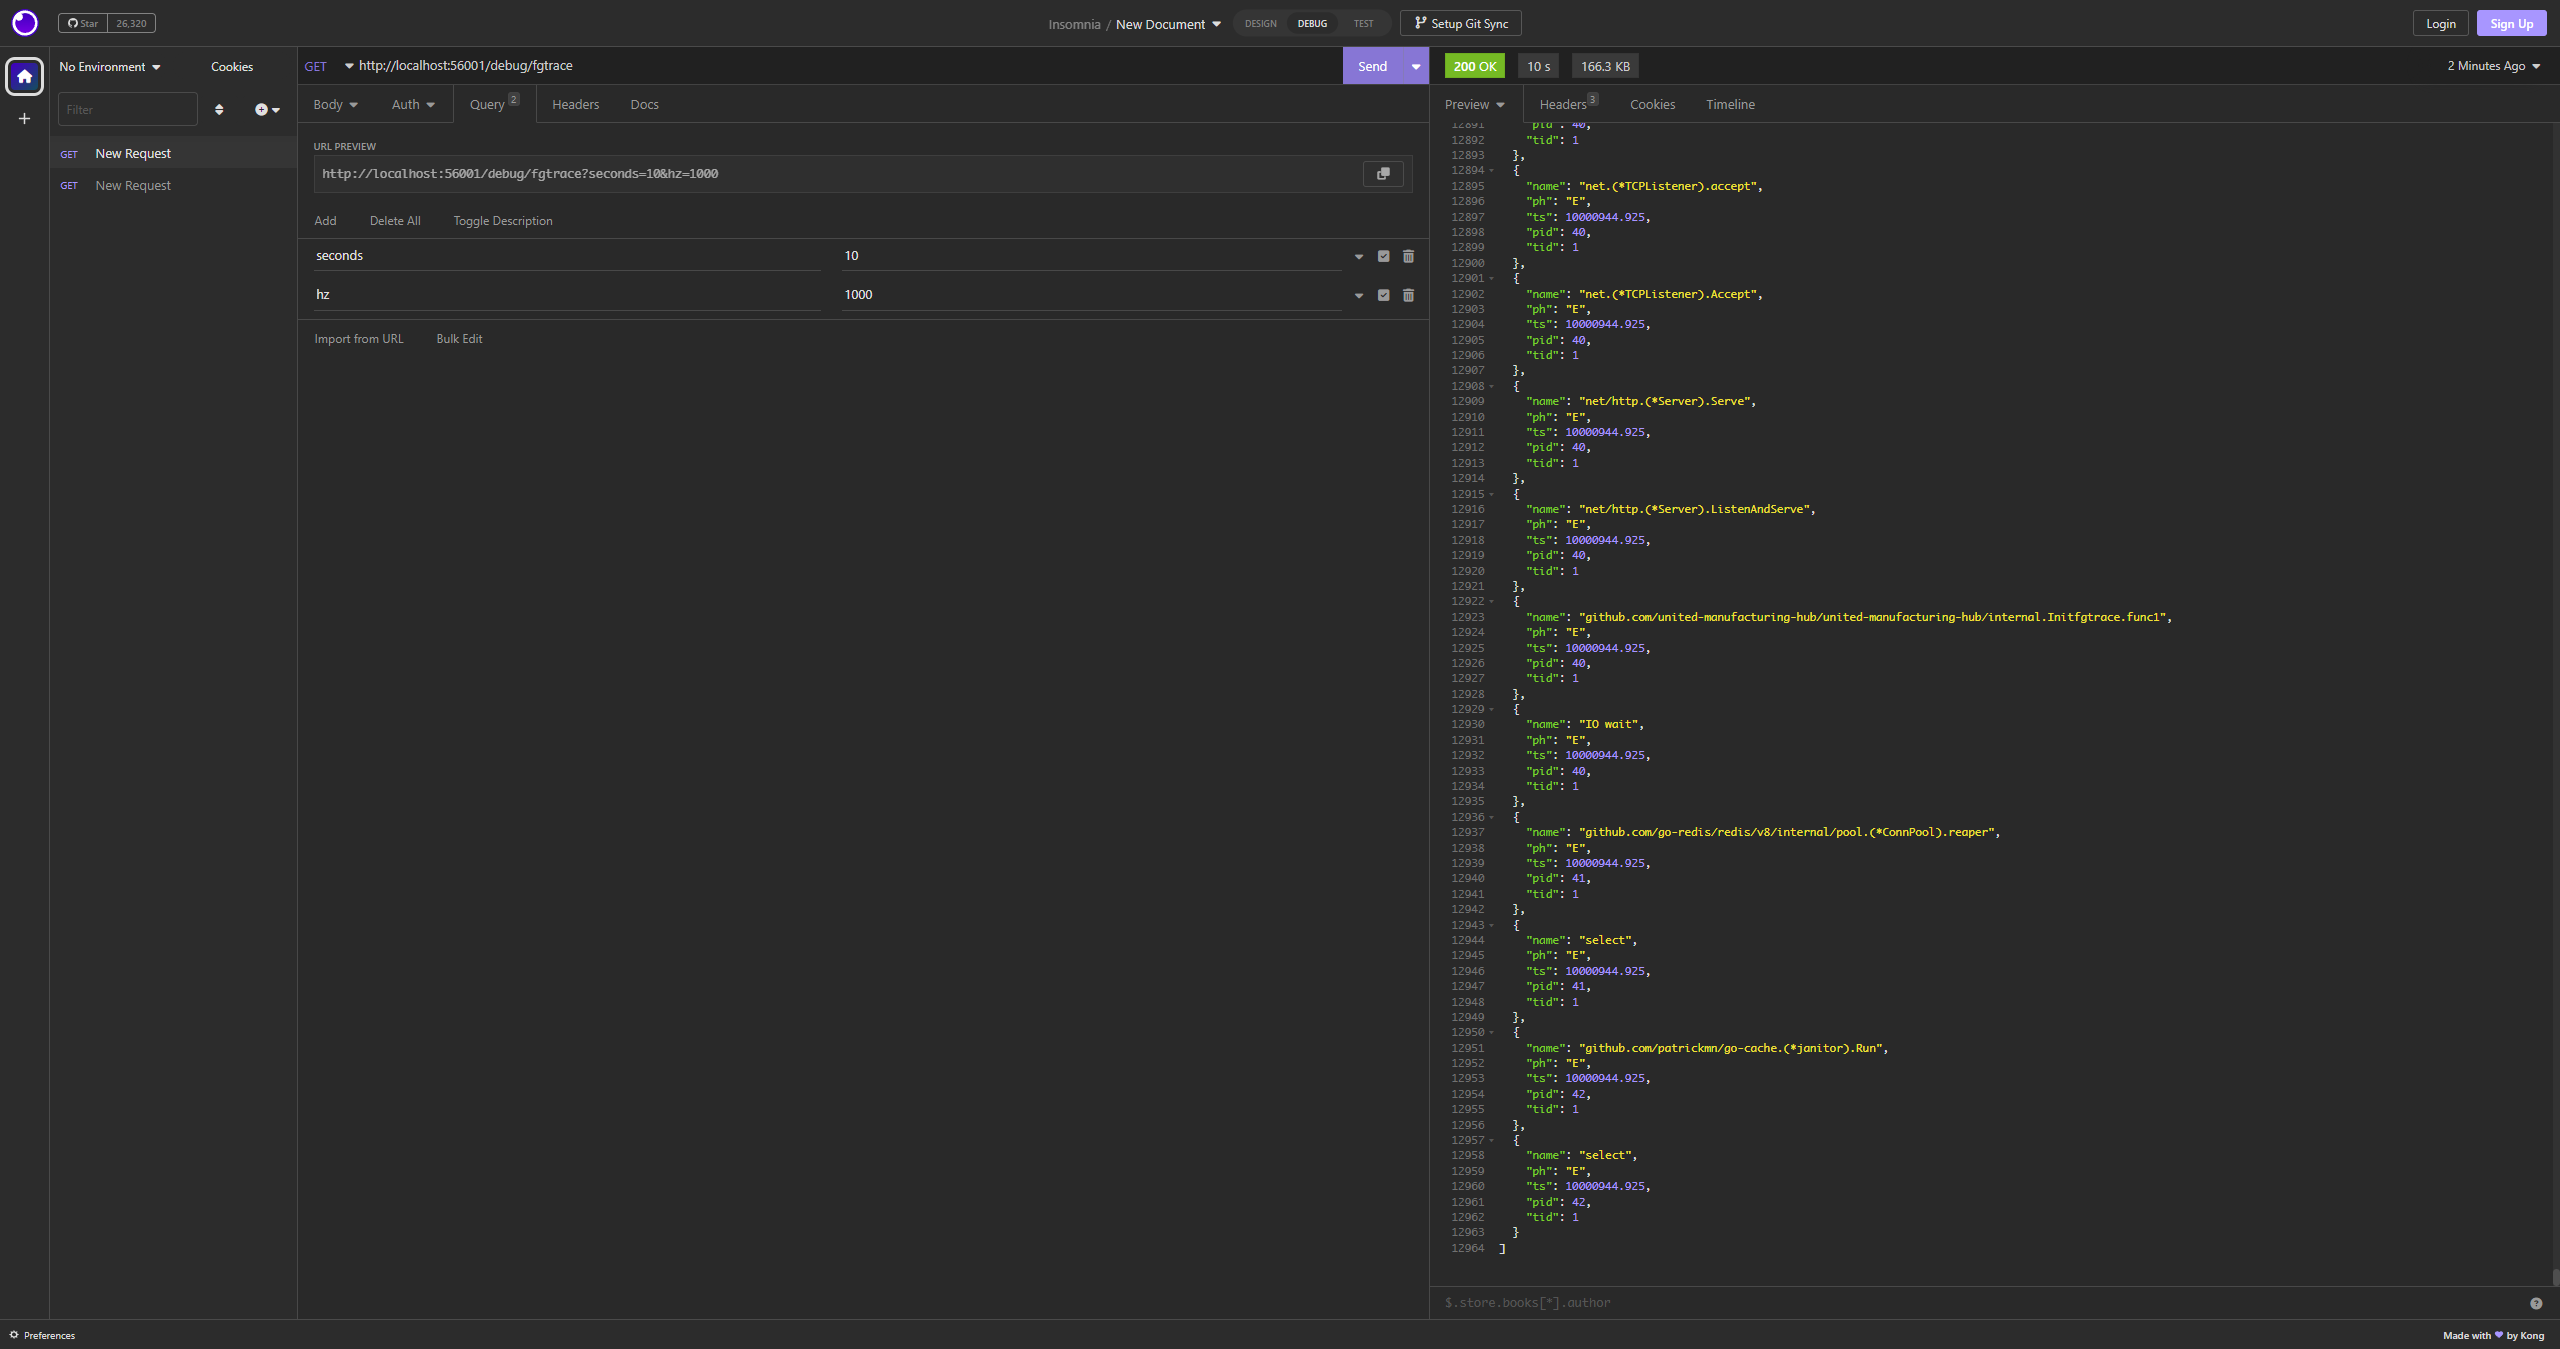
Visit the
/debug/fgtracetrace path using Insomnia or similar. (It will take about half minute for a trace to complete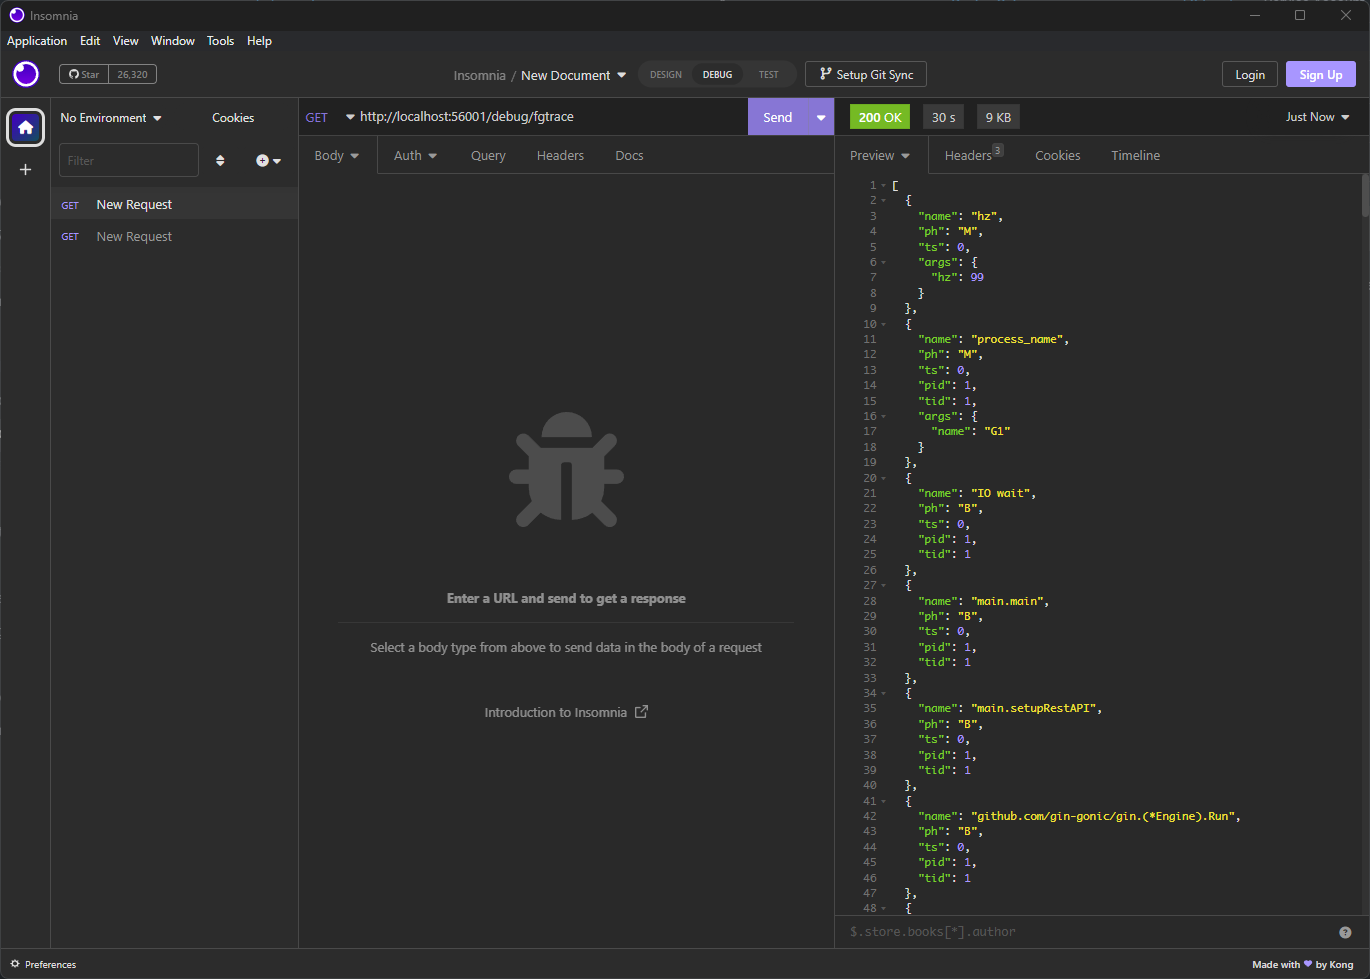
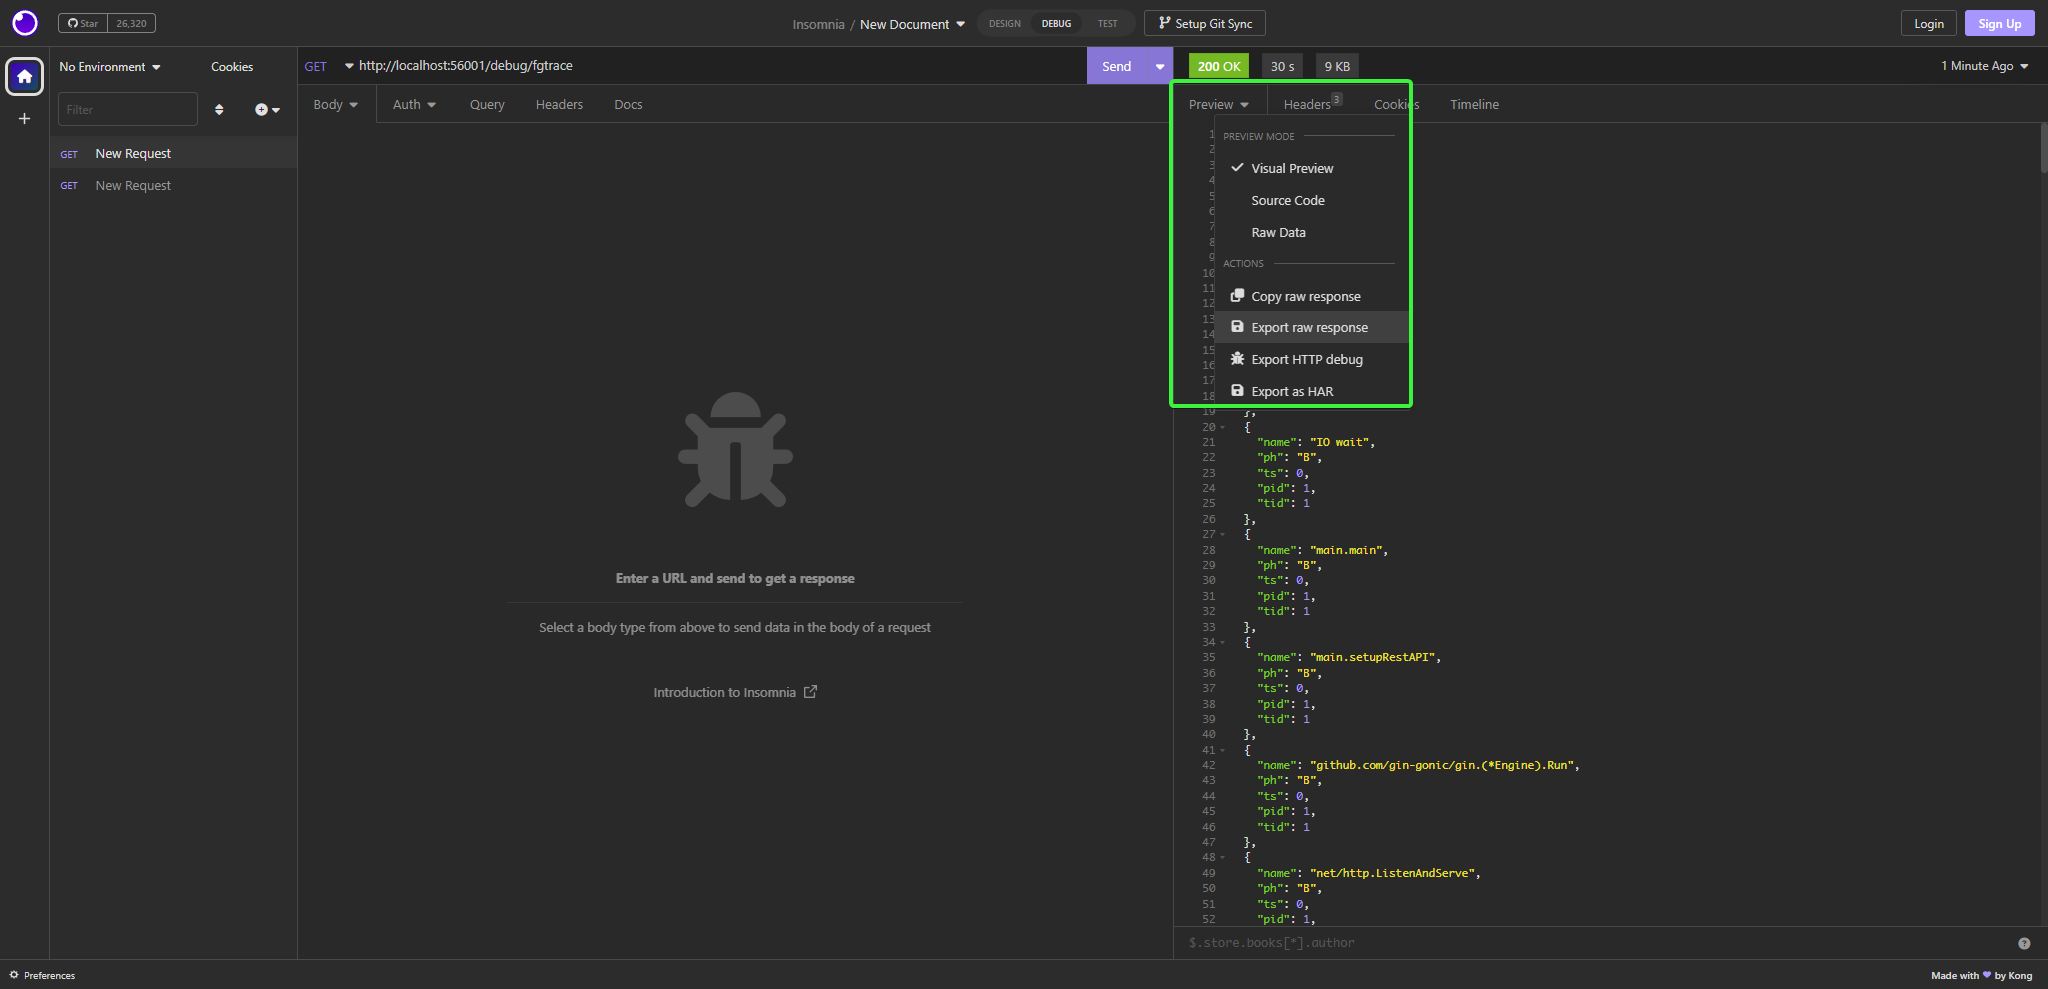
Export the returned JSON
Open the Perfetto UI
Click on “Open trace file” and select the exported JSON
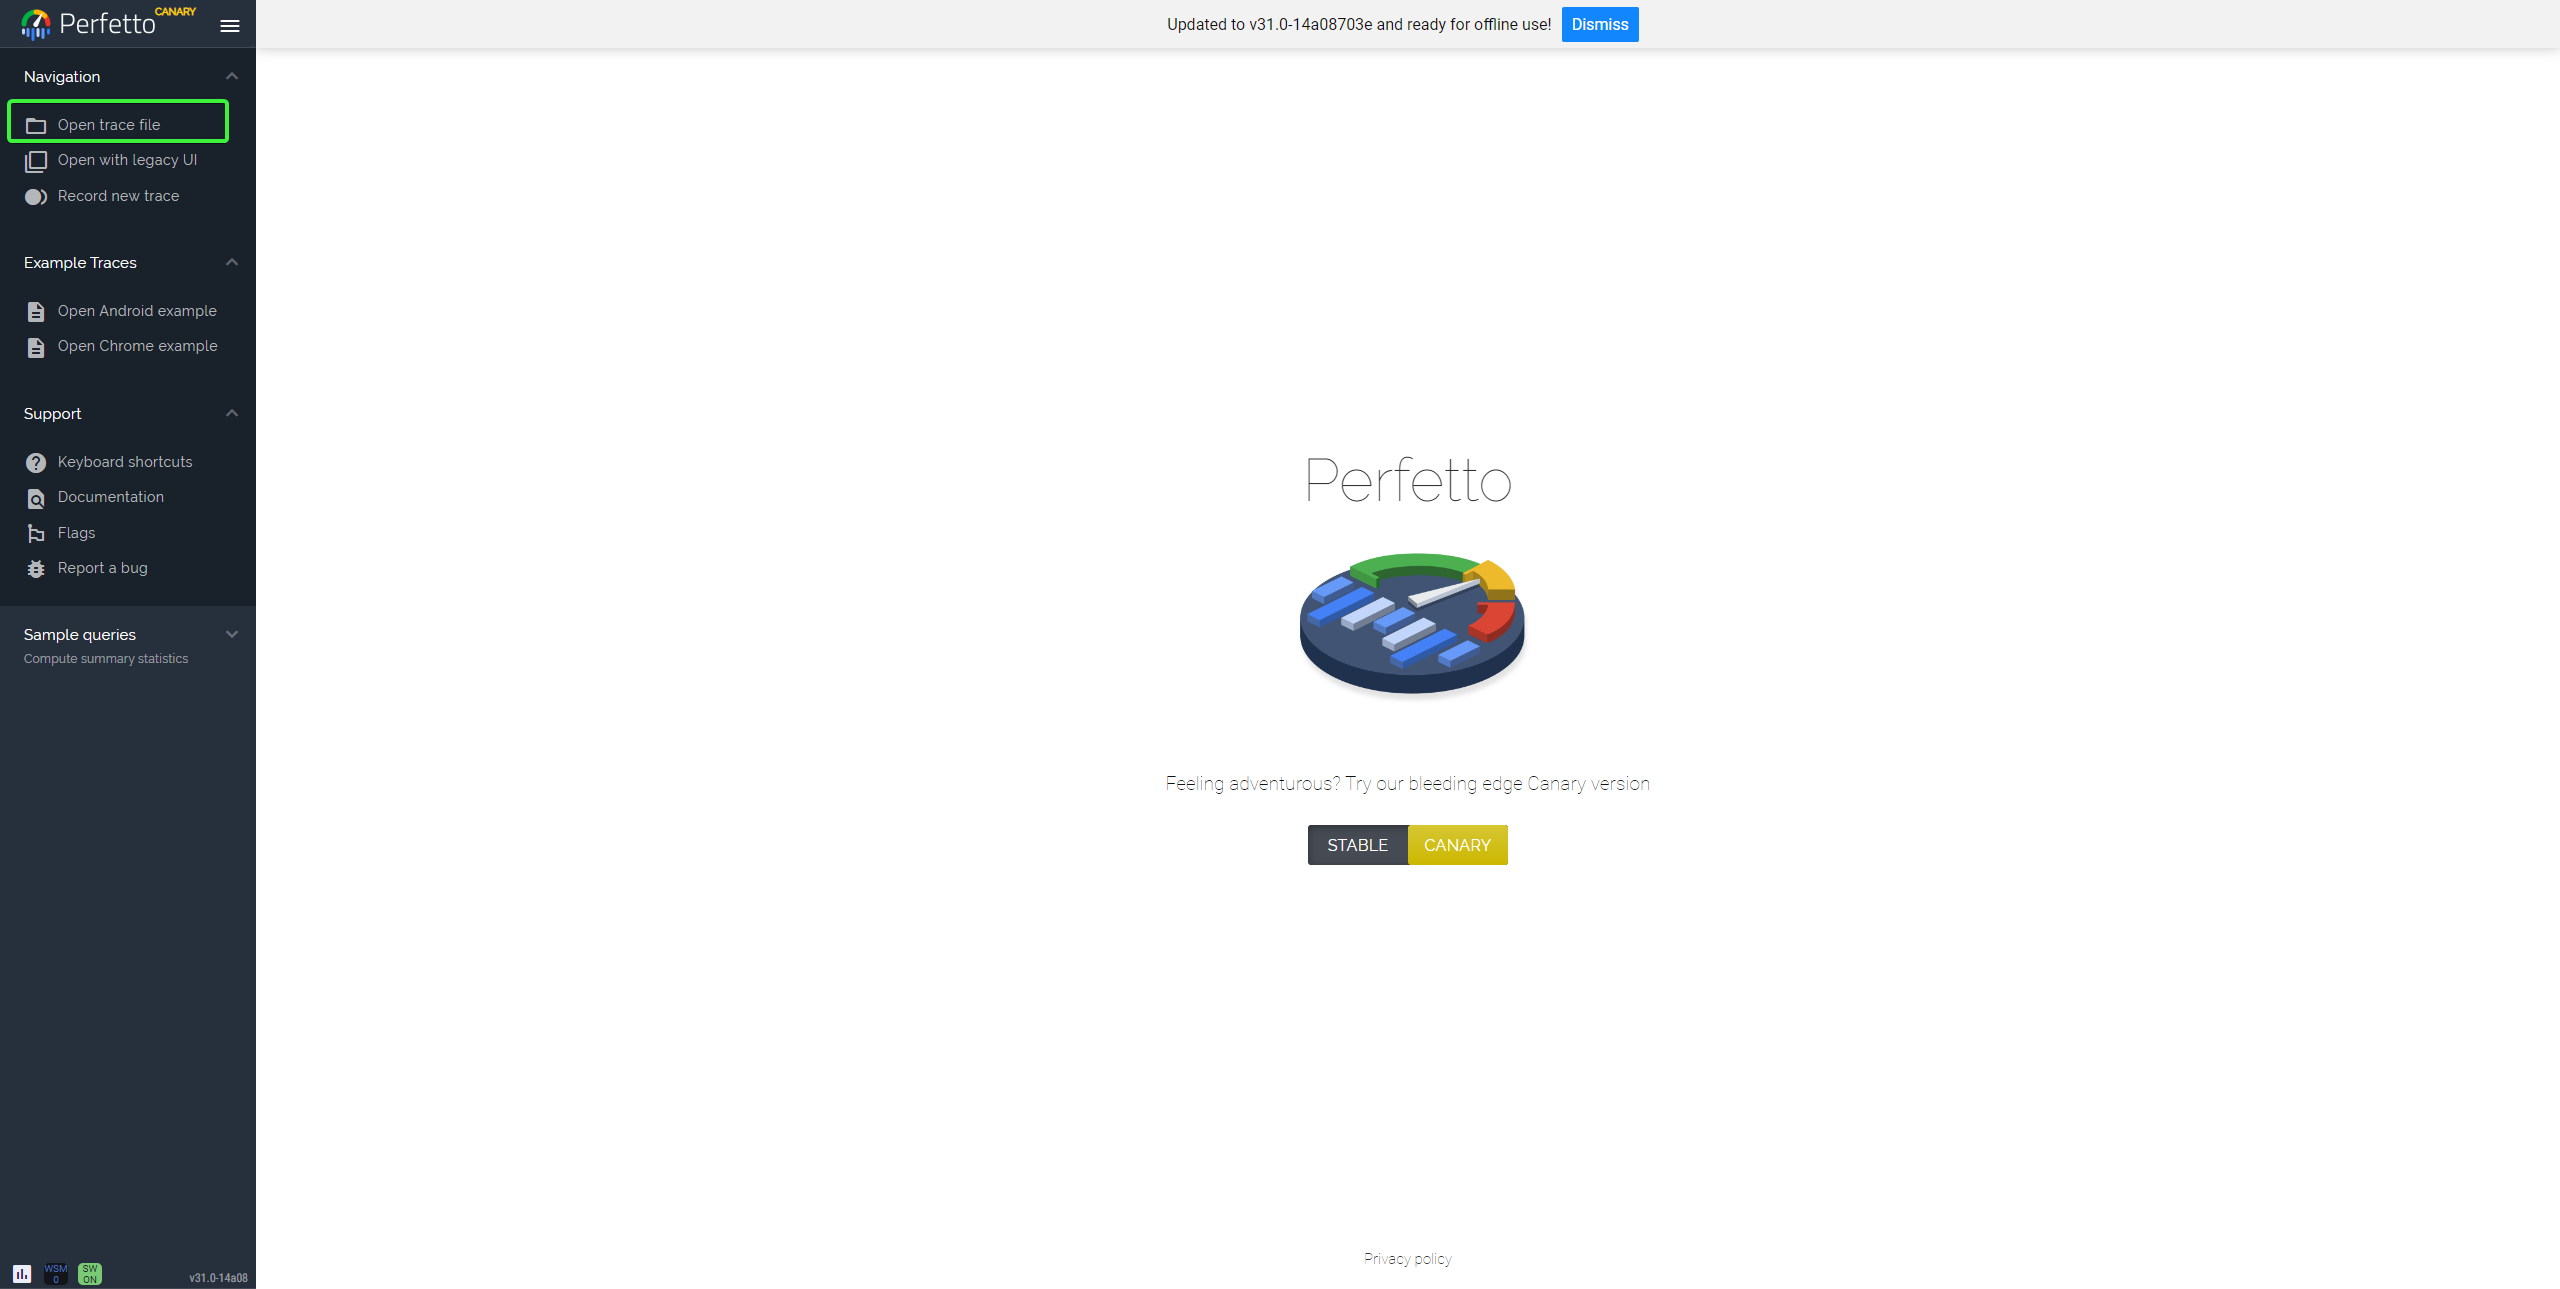
Wait for it to load
You are now seeing a chrome like waterfall graph, showing the wallclock time used by each goroutine
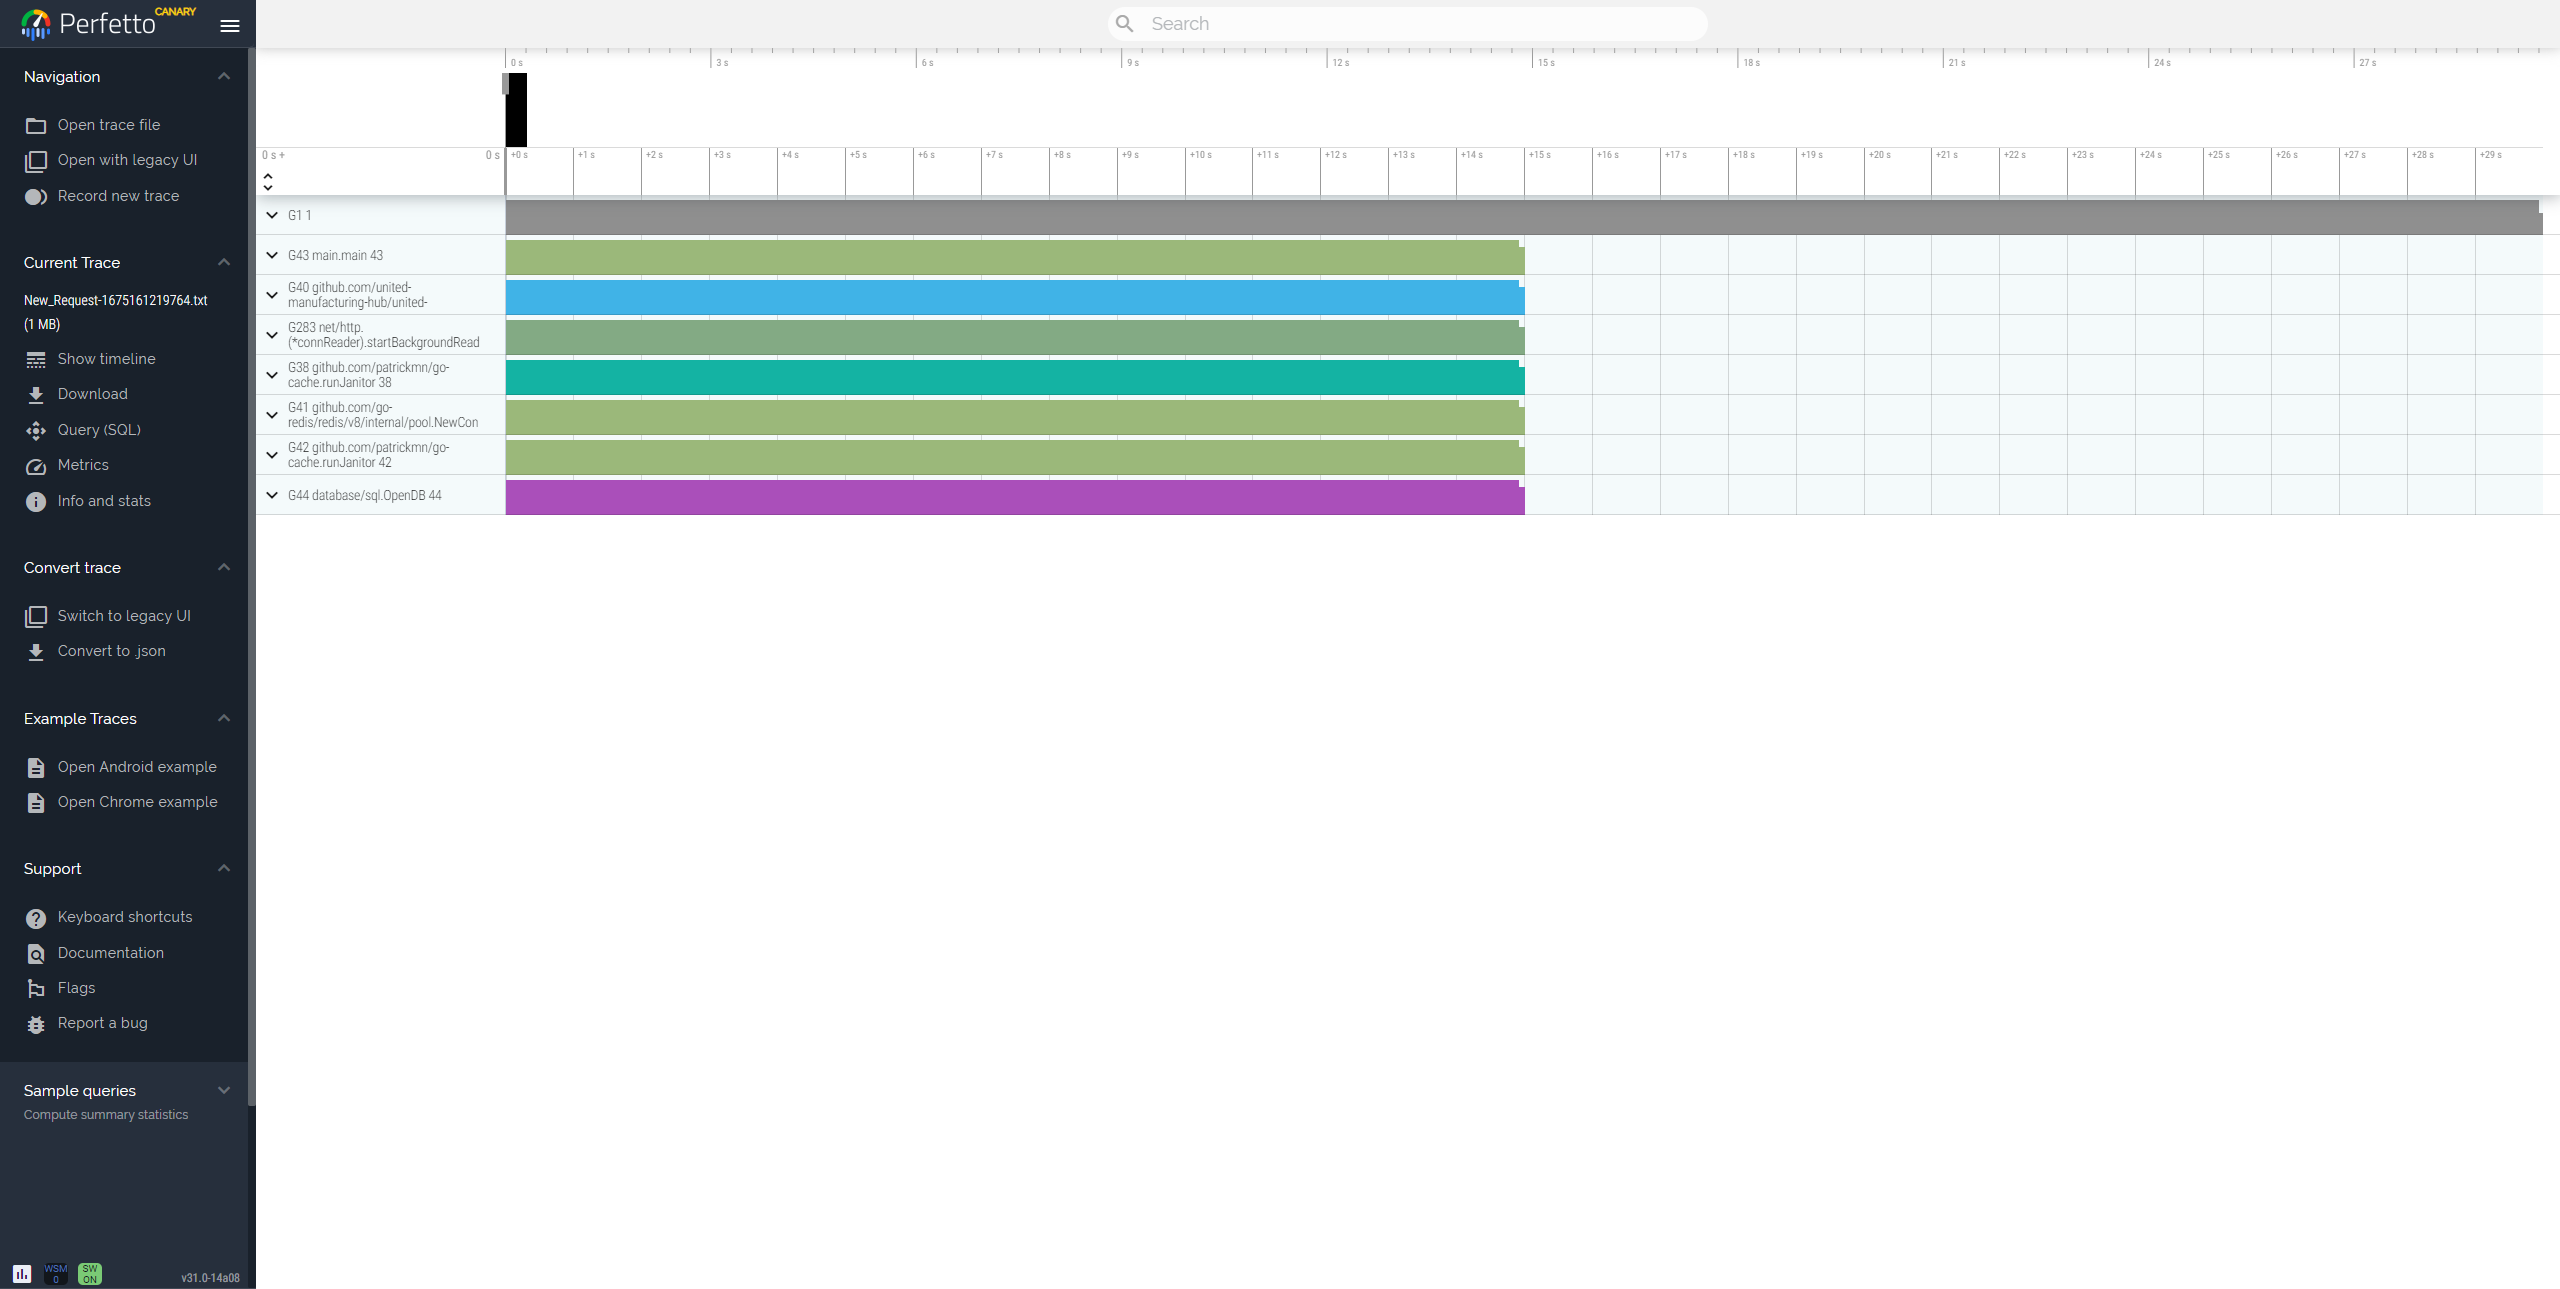
If you expand a goroutine, you can view what function calls it made
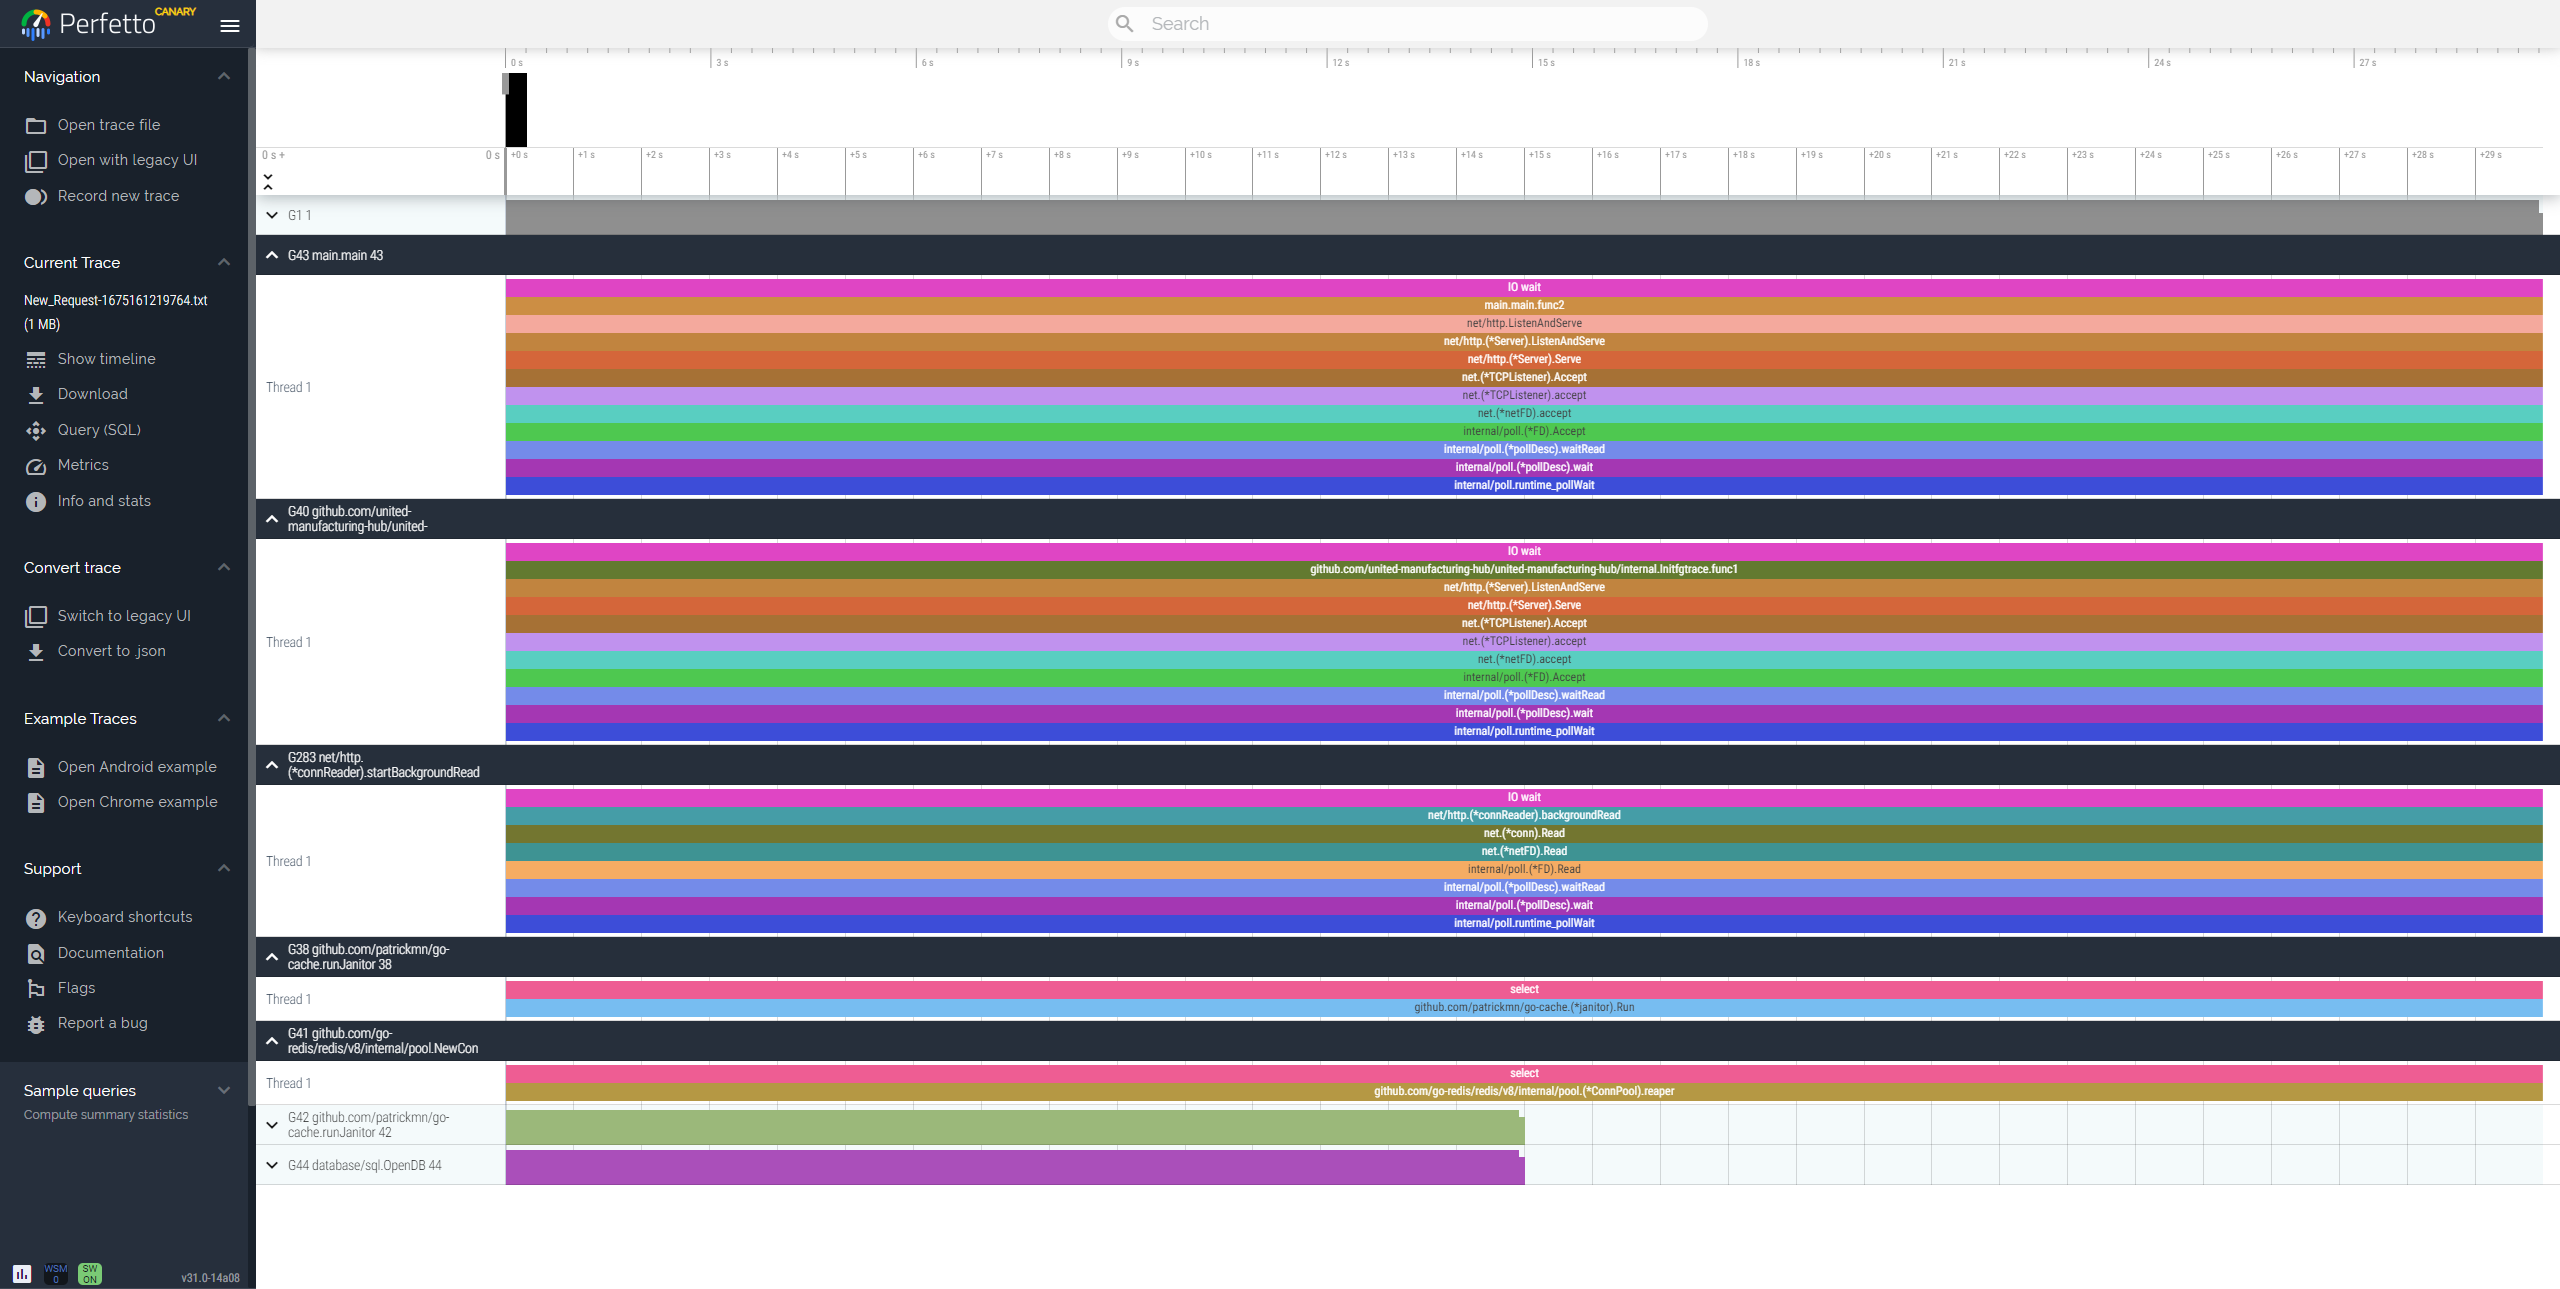
Due to our sampling frequency, function calls under 0.01 seconds will not be captured
Tip:
You can use the query parameters “seconds” and “hz” to control the trace length and frequency
Last modified February 17, 2023: update (#208) (ea731fc)